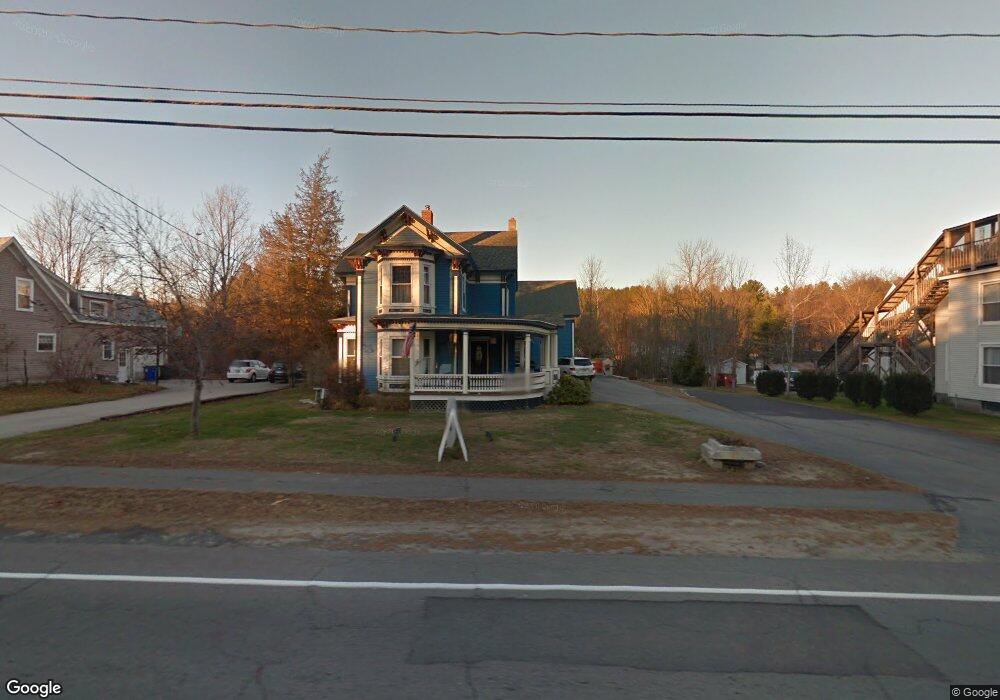
54 N Mast St Goffstown, NH 03045
Estimated Value: $592,000 - $930,271
4
Beds
5
Baths
5,210
Sq Ft
$155/Sq Ft
Est. Value
About This Home
This home is located at 54 N Mast St, Goffstown, NH 03045 and is currently estimated at $809,068, approximately $155 per square foot. 54 N Mast St is a home with nearby schools including Mountain View Middle School and Goffstown High School.
Ownership History
Date
Name
Owned For
Owner Type
Purchase Details
Closed on
Jun 26, 2024
Sold by
Mullaney Joseph
Bought by
Joseph M Mullaney Ft and Mullaney
Current Estimated Value
Purchase Details
Closed on
May 20, 2013
Sold by
Mullaney Karen M
Bought by
Mullaney Joseph
Purchase Details
Closed on
Dec 9, 1997
Sold by
Boisvert Ronald A and Boisvert Linda A
Bought by
Drew Karen M
Home Financials for this Owner
Home Financials are based on the most recent Mortgage that was taken out on this home.
Original Mortgage
$62,800
Interest Rate
7.28%
Create a Home Valuation Report for This Property
The Home Valuation Report is an in-depth analysis detailing your home's value as well as a comparison with similar homes in the area
Home Values in the Area
Average Home Value in this Area
Purchase History
| Date | Buyer | Sale Price | Title Company |
|---|---|---|---|
| Joseph M Mullaney Ft | -- | None Available | |
| Mullaney Joseph | -- | -- | |
| Mullaney Joseph | -- | -- | |
| Drew Karen M | $45,000 | -- | |
| Drew Karen M | $45,000 | -- |
Source: Public Records
Mortgage History
| Date | Status | Borrower | Loan Amount |
|---|---|---|---|
| Previous Owner | Drew Karen M | $30,000 | |
| Previous Owner | Drew Karen M | $62,800 |
Source: Public Records
Tax History
| Year | Tax Paid | Tax Assessment Tax Assessment Total Assessment is a certain percentage of the fair market value that is determined by local assessors to be the total taxable value of land and additions on the property. | Land | Improvement |
|---|---|---|---|---|
| 2025 | $15,077 | $722,100 | $193,600 | $528,500 |
| 2024 | $14,760 | $722,100 | $193,600 | $528,500 |
| 2023 | $13,619 | $722,100 | $193,600 | $528,500 |
| 2022 | $12,429 | $472,400 | $158,200 | $314,200 |
| 2021 | $11,725 | $472,400 | $158,200 | $314,200 |
| 2020 | $11,725 | $472,400 | $158,200 | $314,200 |
| 2019 | $11,612 | $472,400 | $158,200 | $314,200 |
| 2018 | $8,787 | $472,400 | $158,200 | $314,200 |
| 2017 | $11,549 | $421,200 | $131,300 | $289,900 |
| 2016 | $11,140 | $421,500 | $131,300 | $290,200 |
| 2015 | $11,058 | $392,700 | $122,700 | $270,000 |
| 2014 | $10,603 | $392,700 | $122,700 | $270,000 |
Source: Public Records
Map
Nearby Homes
- 10 Autumn St
- 9 Maple Ave
- 129 New Boston Rd
- 47 E Union St
- 120 S Mast St
- 140 S Mast St
- 31 Pine Crest Dr
- 234 Paige Hill Rd
- 5D Dearborn Cir
- 144 S Mast St
- 30 Horizon Dr
- 00 Bog Brook Rd Unit multiple
- 129 Mountain Base Rd
- 0 Fairway Dr Unit 11
- 174 S Stark Hwy Unit 1
- 174 S Stark Hwy Unit 23
- 189 Byam Rd
- Map 6 Lot 40 River Rd
- 401 Wallace Rd
- 93 Daniels Rd
Your Personal Tour Guide
Ask me questions while you tour the home.