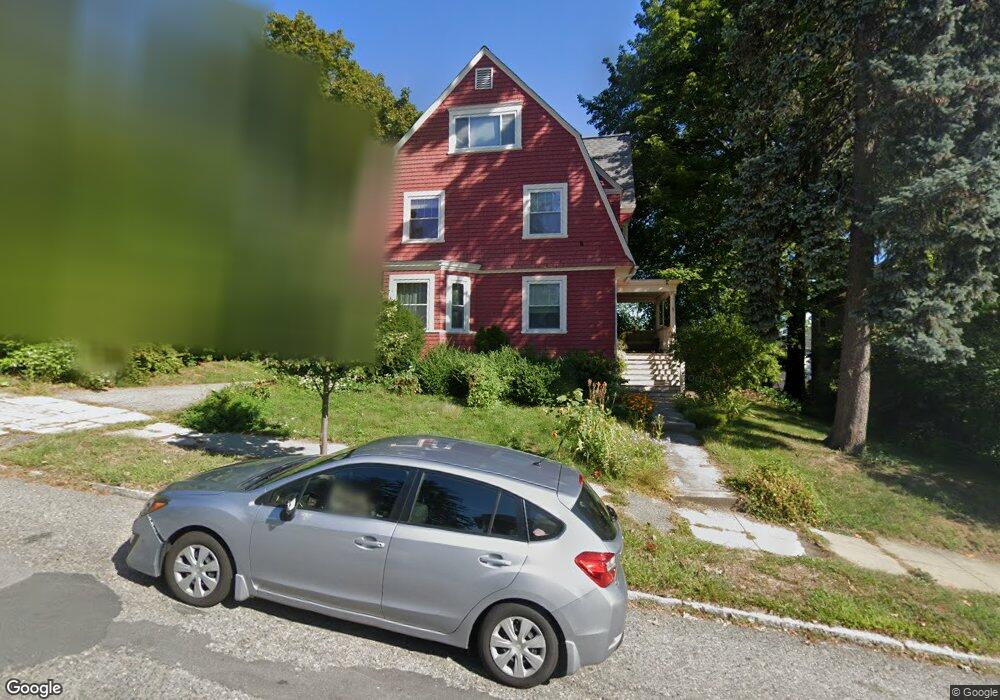
54 Sagamore Rd Worcester, MA 01609
Indian Lake East NeighborhoodEstimated Value: $590,252 - $748,000
5
Beds
2
Baths
2,336
Sq Ft
$284/Sq Ft
Est. Value
About This Home
This home is located at 54 Sagamore Rd, Worcester, MA 01609 and is currently estimated at $663,063, approximately $283 per square foot. 54 Sagamore Rd is a home located in Worcester County with nearby schools including Jacob Hiatt Magnet School, Chandler Magnet, and Flagg Street School.
Ownership History
Date
Name
Owned For
Owner Type
Purchase Details
Closed on
Apr 16, 2008
Sold by
Thompson Troy B
Bought by
Thompson Tamisha S and Thompson Troy B
Current Estimated Value
Home Financials for this Owner
Home Financials are based on the most recent Mortgage that was taken out on this home.
Original Mortgage
$296,000
Interest Rate
6.1%
Mortgage Type
Purchase Money Mortgage
Purchase Details
Closed on
Nov 6, 2006
Sold by
Shute Derek F and Thompson Troy B
Bought by
Thompson Troy B
Home Financials for this Owner
Home Financials are based on the most recent Mortgage that was taken out on this home.
Original Mortgage
$241,600
Interest Rate
6.47%
Mortgage Type
Purchase Money Mortgage
Purchase Details
Closed on
May 15, 1998
Sold by
Kokernak Henry J
Bought by
Thompson Troy B and Shute Derek F
Home Financials for this Owner
Home Financials are based on the most recent Mortgage that was taken out on this home.
Original Mortgage
$130,062
Interest Rate
7.08%
Mortgage Type
Purchase Money Mortgage
Create a Home Valuation Report for This Property
The Home Valuation Report is an in-depth analysis detailing your home's value as well as a comparison with similar homes in the area
Home Values in the Area
Average Home Value in this Area
Purchase History
| Date | Buyer | Sale Price | Title Company |
|---|---|---|---|
| Thompson Tamisha S | -- | -- | |
| Thompson Troy B | $80,000 | -- | |
| Thompson Troy B | $132,500 | -- |
Source: Public Records
Mortgage History
| Date | Status | Borrower | Loan Amount |
|---|---|---|---|
| Open | Thompson Troy B | $285,602 | |
| Closed | Thompson Tamisha S | $296,000 | |
| Previous Owner | Thompson Troy B | $241,600 | |
| Previous Owner | Thompson Troy B | $125,000 | |
| Previous Owner | Thompson Troy B | $130,062 |
Source: Public Records
Tax History
| Year | Tax Paid | Tax Assessment Tax Assessment Total Assessment is a certain percentage of the fair market value that is determined by local assessors to be the total taxable value of land and additions on the property. | Land | Improvement |
|---|---|---|---|---|
| 2025 | $6,675 | $506,100 | $123,700 | $382,400 |
| 2024 | $6,531 | $475,000 | $123,700 | $351,300 |
| 2023 | $6,287 | $438,400 | $106,500 | $331,900 |
| 2022 | $5,842 | $384,100 | $85,200 | $298,900 |
| 2021 | $14,049 | $357,300 | $68,200 | $289,100 |
| 2020 | $5,630 | $331,200 | $68,000 | $263,200 |
| 2019 | $12,996 | $318,000 | $65,600 | $252,400 |
| 2018 | $12,745 | $299,900 | $65,600 | $234,300 |
| 2017 | $12,243 | $285,100 | $65,600 | $219,500 |
| 2016 | $5,627 | $273,000 | $54,100 | $218,900 |
| 2015 | $5,479 | $273,000 | $54,100 | $218,900 |
| 2014 | $5,334 | $273,000 | $54,100 | $218,900 |
Source: Public Records
Map
Nearby Homes
- 23 Dryden St
- 49 Metcalf St
- 20B Edgeworth St
- 59 Beechmont St
- 6 Roald St
- 80 Salisbury St Unit 206
- 27 Harlow St
- 3 Perkins St
- 40 Westwood Dr
- 8 Old Colony Rd
- 9 Dover St
- 93 Newton Ave N
- 15 Goulding St
- 83 Newton Ave N
- 60 Fruit St
- 14 Balder Rd
- 6 Paul Revere Rd
- 74 Green Hill Pkwy
- 577 Grove St
- 78 Green Hill Pkwy
- 48 Sagamore Rd
- 48 Sagamore Rd Unit 50
- 48 Sagamore Rd Unit 2
- 48 Sagamore Rd Unit 1
- 60 Sagamore Rd
- 46 Park Ave
- 46 Park Ave Unit 1c
- 46 Park Ave Unit 1B
- 44-46 Sagamore Rd
- 44 Sagamore Rd
- 64 Sagamore Rd
- 2 Pratt St
- 47 Sagamore Rd Unit 1
- 8 Pratt St
- 53 Sagamore Rd
- 57 Sagamore Rd
- 68 Sagamore Rd
- 6 Pratt St
- 49 Sagamore Rd
- 61 Sagamore Rd
Your Personal Tour Guide
Ask me questions while you tour the home.