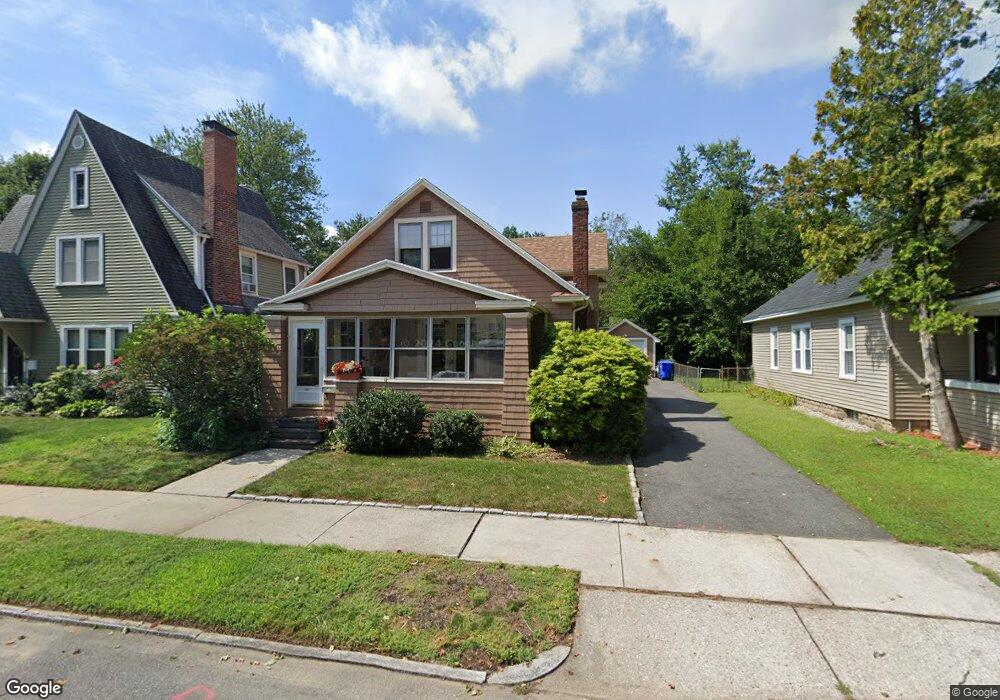
54 Thorndyke St Springfield, MA 01118
East Forest Park NeighborhoodEstimated Value: $243,000 - $290,000
2
Beds
1
Bath
1,032
Sq Ft
$255/Sq Ft
Est. Value
About This Home
This home is located at 54 Thorndyke St, Springfield, MA 01118 and is currently estimated at $262,812, approximately $254 per square foot. 54 Thorndyke St is a home located in Hampden County with nearby schools including Frederick Harris Elementary School, M Marcus Kiley Middle, and High School Of Commerce.
Ownership History
Date
Name
Owned For
Owner Type
Purchase Details
Closed on
Oct 27, 1992
Sold by
Poulin Armand S and Damon Claire D
Bought by
Lamson Patricia A
Current Estimated Value
Home Financials for this Owner
Home Financials are based on the most recent Mortgage that was taken out on this home.
Original Mortgage
$78,014
Interest Rate
7.79%
Mortgage Type
Purchase Money Mortgage
Create a Home Valuation Report for This Property
The Home Valuation Report is an in-depth analysis detailing your home's value as well as a comparison with similar homes in the area
Home Values in the Area
Average Home Value in this Area
Purchase History
| Date | Buyer | Sale Price | Title Company |
|---|---|---|---|
| Lamson Patricia A | $78,000 | -- |
Source: Public Records
Mortgage History
| Date | Status | Borrower | Loan Amount |
|---|---|---|---|
| Open | Lamson Patricia A | $79,000 | |
| Closed | Lamson Patricia A | $68,000 | |
| Closed | Lamson Patricia A | $76,000 | |
| Closed | Lamson Patricia A | $78,014 |
Source: Public Records
Tax History
| Year | Tax Paid | Tax Assessment Tax Assessment Total Assessment is a certain percentage of the fair market value that is determined by local assessors to be the total taxable value of land and additions on the property. | Land | Improvement |
|---|---|---|---|---|
| 2025 | $3,160 | $201,500 | $37,600 | $163,900 |
| 2024 | $3,243 | $201,900 | $37,600 | $164,300 |
| 2023 | $3,211 | $188,300 | $35,800 | $152,500 |
| 2022 | $2,740 | $145,600 | $35,800 | $109,800 |
| 2021 | $2,663 | $140,900 | $32,600 | $108,300 |
| 2020 | $2,506 | $128,300 | $32,600 | $95,700 |
| 2019 | $2,391 | $121,500 | $32,600 | $88,900 |
| 2018 | $2,306 | $117,200 | $32,600 | $84,600 |
| 2017 | $2,121 | $107,900 | $31,100 | $76,800 |
| 2016 | $2,233 | $113,600 | $31,100 | $82,500 |
| 2015 | $2,113 | $107,400 | $31,100 | $76,300 |
Source: Public Records
Map
Nearby Homes
- 34 Castle St
- 77 Dorset St
- 46 Eckington St
- 161 Dorset St
- 67 Perkins St
- 854-856 Sumner Ave
- 13 Bither St
- 88 Brunswick St
- 1088 Sumner Ave
- 59 Daviston St
- 914-916 Belmont Ave
- 134 Eddywood St
- 79 Roosevelt Ave
- 22 Eleanor Rd
- 79 Arvilla St
- 410 Allen St
- 47 Hartford Terrace
- 55 Mandalay Rd
- 170 Plumtree Rd
- 33-35 Ruskin St
- 48 Thorndyke St
- 58 Thorndyke St
- 55 Spencer St
- 55 Spencer St Unit 55
- 55 Spencer St Unit 1
- 44 Thorndyke St
- 49 Spencer St
- 61 Spencer St
- 61 Spencer St Unit 1
- 45 Spencer St
- 45 Spencer St Unit 45
- 68 Thorndyke St
- 38 Thorndyke St
- 39 Spencer St
- 53 Thorndyke St
- 47 Thorndyke St
- 57 Thorndyke St
- 35 Spencer St
- 34 Thorndyke St
- 37 Thorndyke St
Your Personal Tour Guide
Ask me questions while you tour the home.