54 White Oak Cir Saint Charles, IL 60174
Southwest Saint Charles NeighborhoodEstimated Value: $362,174 - $379,000
2
Beds
3
Baths
1,588
Sq Ft
$232/Sq Ft
Est. Value
About This Home
This home is located at 54 White Oak Cir, Saint Charles, IL 60174 and is currently estimated at $367,794, approximately $231 per square foot. 54 White Oak Cir is a home located in Kane County with nearby schools including Davis Primary School, Richmond Intermediate School, and Thompson Middle School.
Ownership History
Date
Name
Owned For
Owner Type
Purchase Details
Closed on
May 17, 2022
Sold by
Joyce Polich Linda
Bought by
Linda Joyce Polich Trust
Current Estimated Value
Purchase Details
Closed on
Sep 5, 2006
Sold by
Moore Lionel D and Wilson Beverly D
Bought by
Polich Linda J
Home Financials for this Owner
Home Financials are based on the most recent Mortgage that was taken out on this home.
Original Mortgage
$95,000
Interest Rate
6.47%
Mortgage Type
Purchase Money Mortgage
Purchase Details
Closed on
Aug 29, 2001
Sold by
Decla Butlett Marc J and Decla Geraldine C Butlett 1993
Bought by
Moore Lionel D
Home Financials for this Owner
Home Financials are based on the most recent Mortgage that was taken out on this home.
Original Mortgage
$124,000
Interest Rate
7.03%
Create a Home Valuation Report for This Property
The Home Valuation Report is an in-depth analysis detailing your home's value as well as a comparison with similar homes in the area
Home Values in the Area
Average Home Value in this Area
Purchase History
| Date | Buyer | Sale Price | Title Company |
|---|---|---|---|
| Linda Joyce Polich Trust | -- | Lacava Law Firm Llc | |
| Polich Linda J | $200,000 | Regent Title Ins Agency Llc | |
| Moore Lionel D | $155,000 | Chicago Title Insurance Co |
Source: Public Records
Mortgage History
| Date | Status | Borrower | Loan Amount |
|---|---|---|---|
| Previous Owner | Polich Linda J | $95,000 | |
| Previous Owner | Moore Lionel D | $124,000 | |
| Closed | Moore Lionel D | $15,500 |
Source: Public Records
Tax History Compared to Growth
Tax History
| Year | Tax Paid | Tax Assessment Tax Assessment Total Assessment is a certain percentage of the fair market value that is determined by local assessors to be the total taxable value of land and additions on the property. | Land | Improvement |
|---|---|---|---|---|
| 2024 | $6,202 | $91,551 | $21,599 | $69,952 |
| 2023 | $5,918 | $81,939 | $19,331 | $62,608 |
| 2022 | $5,363 | $72,419 | $18,446 | $53,973 |
| 2021 | $5,141 | $69,030 | $17,583 | $51,447 |
| 2020 | $5,082 | $67,743 | $17,255 | $50,488 |
| 2019 | $4,985 | $66,401 | $16,913 | $49,488 |
| 2018 | $4,675 | $62,361 | $16,270 | $46,091 |
| 2017 | $4,544 | $60,229 | $15,714 | $44,515 |
| 2016 | $4,215 | $52,135 | $15,162 | $36,973 |
| 2015 | -- | $50,833 | $14,999 | $35,834 |
| 2014 | -- | $49,010 | $14,999 | $34,011 |
| 2013 | -- | $49,998 | $15,149 | $34,849 |
Source: Public Records
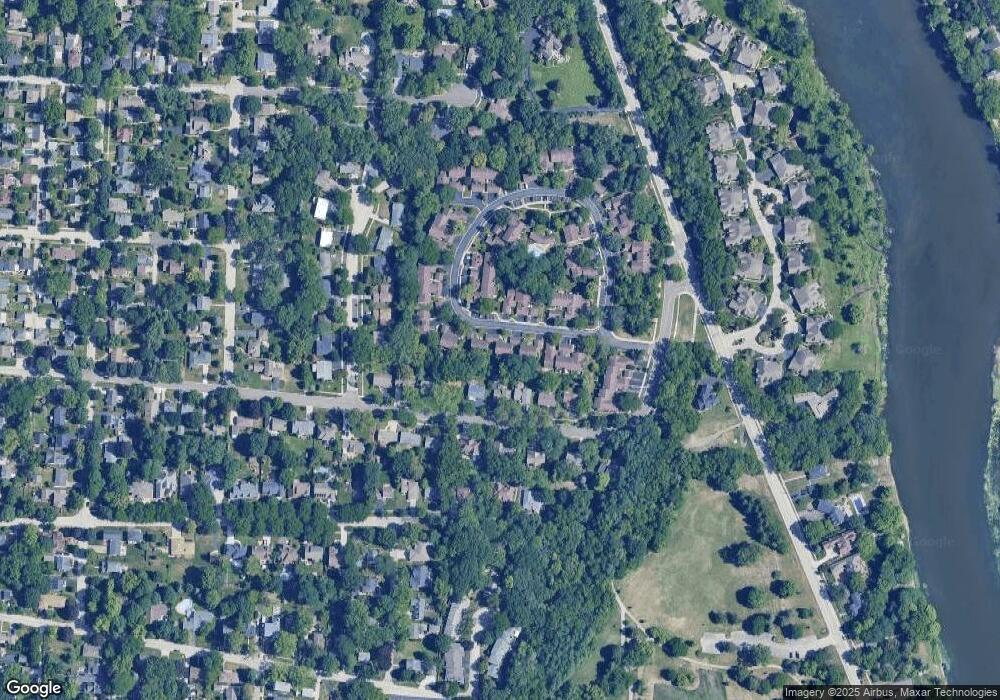
Map
Nearby Homes
- 57 White Oak Cir
- 82 Gray St
- 1008 Pine St
- Lot 1 Geneva Rd
- Lot 2 Geneva Rd
- Lot 1 Keller Place
- 885 Geneva Rd
- 800 Anderson Blvd
- 802 Union St
- 1205 S 4th St
- 835 N Bennett St
- 420 Gray St
- 609 Mckinley Ave
- 1719 S 4th Place
- 629 N Lincoln Ave
- 910 S 4th St
- 1512 S 7th Ave
- 723 S 6th Ave
- 617 Horne St
- 1015 S 6th St
- 55 White Oak Cir
- 53 White Oak Cir
- 56 White Oak Cir
- 52 White Oak Cir
- 30 Roosevelt St
- 51 White Oak Cir
- 32 Roosevelt St
- 58 White Oak Cir
- 71 White Oak Cir
- 69 White Oak Cir Unit 2
- 50 White Oak Cir
- 68 White Oak Cir
- 34 Roosevelt St
- 34 Roosevelt St Unit 46-B
- 34 Roosevelt St Unit 46-E
- 34 Roosevelt St
- 34 Roosevelt St Unit C
- 34 Roosevelt St Unit 62-C
- 34 Roosevelt St Unit B