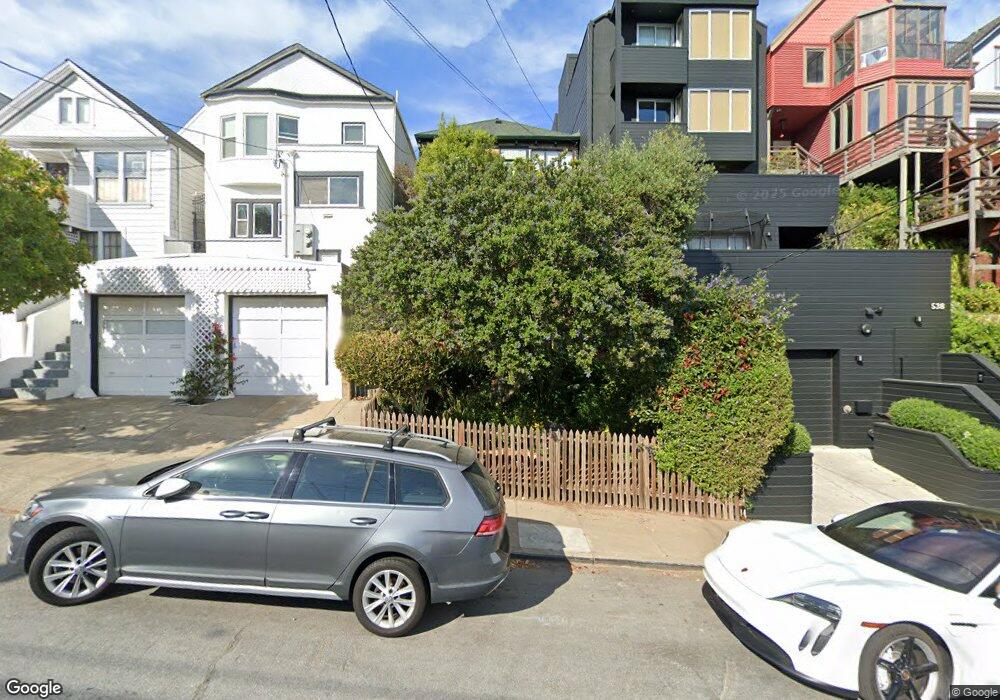
540 28th St San Francisco, CA 94131
Noe Valley NeighborhoodEstimated Value: $866,697 - $5,621,000
2
Beds
1
Bath
667
Sq Ft
$3,344/Sq Ft
Est. Value
About This Home
This home is located at 540 28th St, San Francisco, CA 94131 and is currently estimated at $2,230,674, approximately $3,344 per square foot. 540 28th St is a home located in San Francisco County with nearby schools including Alvarado Elementary, James Lick Middle School, and St. Philip School.
Ownership History
Date
Name
Owned For
Owner Type
Purchase Details
Closed on
Oct 7, 2013
Sold by
Laurie Robert F and Laurie Summer Dawn
Bought by
Laurie Robert F and Laurie Summer Dawn
Current Estimated Value
Home Financials for this Owner
Home Financials are based on the most recent Mortgage that was taken out on this home.
Original Mortgage
$300,000
Interest Rate
4.49%
Mortgage Type
New Conventional
Purchase Details
Closed on
May 4, 2005
Sold by
Curren James J and Peterson Brent J
Bought by
Curren James J and Peterson Brent J
Create a Home Valuation Report for This Property
The Home Valuation Report is an in-depth analysis detailing your home's value as well as a comparison with similar homes in the area
Home Values in the Area
Average Home Value in this Area
Purchase History
| Date | Buyer | Sale Price | Title Company |
|---|---|---|---|
| Laurie Robert F | -- | Fidelity National Title Co | |
| Laurie Robert F | -- | Fidelity National Title Co | |
| Laurie Summer Dawn | -- | Fidelity National Title Co | |
| Curren James J | -- | -- | |
| Curren James J | -- | -- |
Source: Public Records
Mortgage History
| Date | Status | Borrower | Loan Amount |
|---|---|---|---|
| Closed | Laurie Robert F | $300,000 |
Source: Public Records
Tax History Compared to Growth
Tax History
| Year | Tax Paid | Tax Assessment Tax Assessment Total Assessment is a certain percentage of the fair market value that is determined by local assessors to be the total taxable value of land and additions on the property. | Land | Improvement |
|---|---|---|---|---|
| 2025 | $680 | $49,560 | $18,194 | $31,366 |
| 2024 | $680 | $48,590 | $17,838 | $30,752 |
| 2023 | $672 | $47,640 | $17,490 | $30,150 |
| 2022 | $662 | $46,708 | $17,148 | $29,560 |
| 2021 | $652 | $45,794 | $16,812 | $28,982 |
| 2020 | $704 | $45,326 | $16,640 | $28,686 |
| 2019 | $685 | $44,438 | $16,314 | $28,124 |
| 2018 | $663 | $43,570 | $15,996 | $27,574 |
| 2017 | $657 | $42,718 | $15,684 | $27,034 |
| 2016 | $613 | $41,882 | $15,378 | $26,504 |
| 2015 | $604 | $41,254 | $15,148 | $26,106 |
| 2014 | $590 | $40,448 | $14,852 | $25,596 |
Source: Public Records
Map
Nearby Homes