Estimated Value: $443,000 - $489,000
3
Beds
2
Baths
1,012
Sq Ft
$459/Sq Ft
Est. Value
About This Home
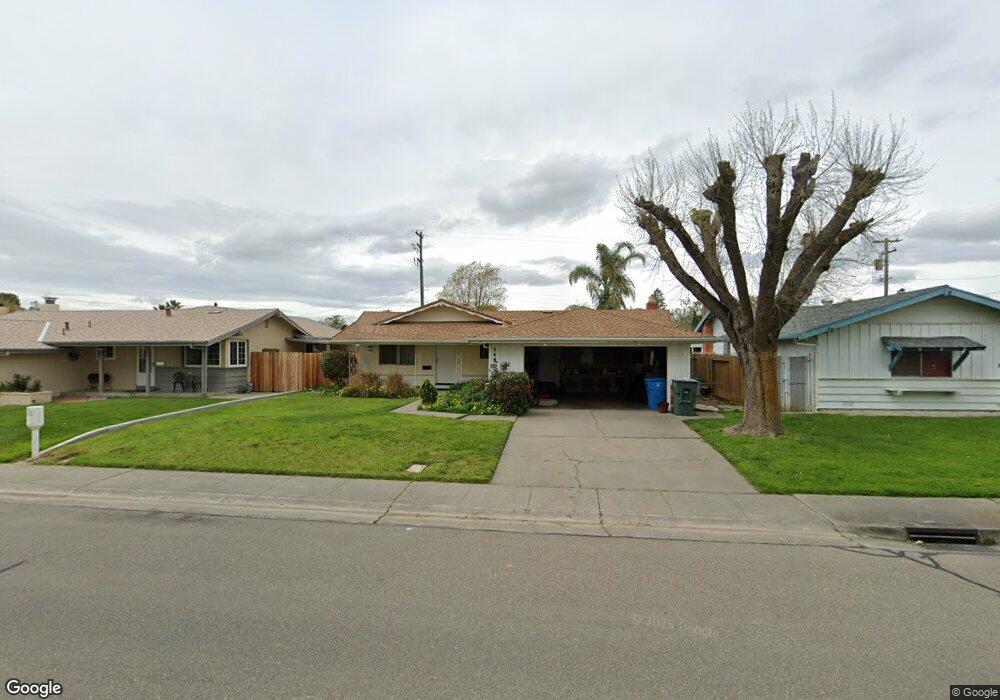
This home is located at 540 S Almond St, Dixon, CA 95620 and is currently estimated at $464,874, approximately $459 per square foot. 540 S Almond St is a home located in Solano County with nearby schools including Anderson (Linford L.) Elementary School, Dixon High School, and Dixon Montessori Charter.
Ownership History
Date
Name
Owned For
Owner Type
Purchase Details
Closed on
Nov 23, 2020
Sold by
Johnston Russell R
Bought by
Johnston Russell R and Russell R Johnston Iii Living
Current Estimated Value
Purchase Details
Closed on
Dec 10, 1993
Sold by
Builders Properties
Bought by
Johnston Russell R and Johnston Russell R
Home Financials for this Owner
Home Financials are based on the most recent Mortgage that was taken out on this home.
Original Mortgage
$121,128
Interest Rate
7.09%
Mortgage Type
FHA
Create a Home Valuation Report for This Property
The Home Valuation Report is an in-depth analysis detailing your home's value as well as a comparison with similar homes in the area
Home Values in the Area
Average Home Value in this Area
Purchase History
| Date | Buyer | Sale Price | Title Company |
|---|---|---|---|
| Johnston Russell R | -- | None Available | |
| Johnston Russell R | $121,000 | -- |
Source: Public Records
Mortgage History
| Date | Status | Borrower | Loan Amount |
|---|---|---|---|
| Closed | Johnston Russell R | $121,128 |
Source: Public Records
Tax History Compared to Growth
Tax History
| Year | Tax Paid | Tax Assessment Tax Assessment Total Assessment is a certain percentage of the fair market value that is determined by local assessors to be the total taxable value of land and additions on the property. | Land | Improvement |
|---|---|---|---|---|
| 2025 | $2,156 | $201,010 | $66,449 | $134,561 |
| 2024 | $2,156 | $197,070 | $65,147 | $131,923 |
| 2023 | $2,090 | $193,207 | $63,870 | $129,337 |
| 2022 | $2,059 | $189,419 | $62,618 | $126,801 |
| 2021 | $2,032 | $185,706 | $61,391 | $124,315 |
| 2020 | $1,999 | $183,803 | $60,762 | $123,041 |
| 2019 | $1,960 | $180,200 | $59,571 | $120,629 |
| 2018 | $1,951 | $176,667 | $58,403 | $118,264 |
| 2017 | $1,901 | $173,204 | $57,258 | $115,946 |
| 2016 | $1,811 | $169,809 | $56,136 | $113,673 |
| 2015 | $1,768 | $167,259 | $55,293 | $111,966 |
| 2014 | $1,748 | $163,983 | $54,210 | $109,773 |
Source: Public Records
Map
Nearby Homes
- 865 Camelia Dr
- 970 Camelia Dr
- 650 Marvin Way
- 255 Alderglen Dr
- 700 W A St
- 1310 Hawthorne Ct
- 1251 Redwood Ct
- 1565 Halsey Ct
- 1250 Redwood Ct
- 1150 Mulberry Ln
- 205 W Cherry St
- 1340 Snowberry Ct
- 1349 Snowberry Ct
- 1305 Valley Glen Dr
- 741 W D St S
- 621 W D St S
- 1316 Bello Dr
- 241 S 1st St
- 0 Pitt School Rd
- 540 Glenside Dr