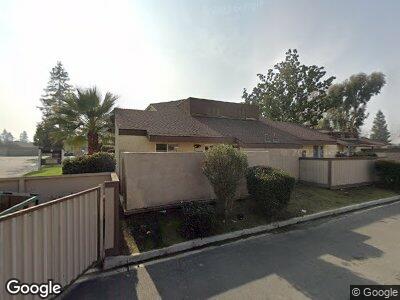
5400 Dunsmuir Rd Unit D Bakersfield, CA 93309
Park Stockdale NeighborhoodEstimated Value: $203,494 - $221,000
2
Beds
1
Bath
853
Sq Ft
$252/Sq Ft
Est. Value
About This Home
This home is located at 5400 Dunsmuir Rd Unit D, Bakersfield, CA 93309 and is currently estimated at $215,124, approximately $252 per square foot. 5400 Dunsmuir Rd Unit D is a home located in Kern County with nearby schools including Wayne Van Horn Elementary School, O.J. Actis Junior High School, and Bakersfield High School.
Ownership History
Date
Name
Owned For
Owner Type
Purchase Details
Closed on
Oct 25, 2021
Sold by
Lawrence Bailey R
Bought by
Lopez Luis E and Andrade America
Current Estimated Value
Home Financials for this Owner
Home Financials are based on the most recent Mortgage that was taken out on this home.
Original Mortgage
$161,500
Outstanding Balance
$151,155
Interest Rate
3.05%
Mortgage Type
New Conventional
Purchase Details
Closed on
Oct 7, 2019
Sold by
Gill Gregory E
Bought by
Lawrence Bailey R
Home Financials for this Owner
Home Financials are based on the most recent Mortgage that was taken out on this home.
Original Mortgage
$1,225
Interest Rate
3.5%
Purchase Details
Closed on
Sep 14, 2015
Sold by
Gill Gregory E
Bought by
Gill Gregory E and Gregory E Gill Living Trust
Purchase Details
Closed on
Jun 19, 2007
Sold by
Ponte Bobby
Bought by
Gill Gregory E
Create a Home Valuation Report for This Property
The Home Valuation Report is an in-depth analysis detailing your home's value as well as a comparison with similar homes in the area
Home Values in the Area
Average Home Value in this Area
Purchase History
| Date | Buyer | Sale Price | Title Company |
|---|---|---|---|
| Lopez Luis E | $170,000 | Chicago Title Company | |
| Lawrence Bailey R | $70,000 | Ticor Title Company | |
| Gill Gregory E | -- | None Available | |
| Gill Gregory E | $145,000 | First American Title Company |
Source: Public Records
Mortgage History
| Date | Status | Borrower | Loan Amount |
|---|---|---|---|
| Open | Lopez Luis E | $161,500 | |
| Previous Owner | Lawrence Bailey R | $1,225 |
Source: Public Records
Tax History Compared to Growth
Tax History
| Year | Tax Paid | Tax Assessment Tax Assessment Total Assessment is a certain percentage of the fair market value that is determined by local assessors to be the total taxable value of land and additions on the property. | Land | Improvement |
|---|---|---|---|---|
| 2024 | $2,463 | $176,868 | $31,212 | $145,656 |
| 2023 | $2,463 | $173,400 | $30,600 | $142,800 |
| 2022 | $2,367 | $170,000 | $30,000 | $140,000 |
| 2021 | $1,638 | $113,159 | $40,414 | $72,745 |
| 2020 | $1,638 | $112,000 | $40,000 | $72,000 |
| 2019 | $1,714 | $120,000 | $30,000 | $90,000 |
| 2018 | $1,473 | $105,000 | $30,000 | $75,000 |
| 2017 | $1,444 | $102,000 | $20,000 | $82,000 |
| 2016 | $1,161 | $83,000 | $15,000 | $68,000 |
| 2015 | $1,087 | $76,000 | $10,000 | $66,000 |
| 2014 | $1,080 | $76,000 | $10,000 | $66,000 |
Source: Public Records
Map
Nearby Homes
- 5500 Dunsmuir Rd Unit 34
- 5401 Dunsmuir Rd Unit 30
- 108 Durham Ct
- 157 N McDonald Way
- 201 Glen Oaks Dr
- 5413 Demaret Ave
- 611 Hewlett St
- 5501 Spyglass Hill Ct
- 505 New Stine Rd
- 4621 Quarter Ave
- 149 Morrison St
- 5101 Hunter Ave Unit 2
- 609 Taylor St Unit 14
- 5909 Desert Hills Ave
- 1001 Mohawk St Unit 75
- 105 Holmby Ct
- 516 Birkdale Way
- 5060 Easton Dr
- 5812 Burke Way
- 4408 Fishering Dr
- 5400 Dunsmuir Rd Unit 26
- 5400 Dunsmuir Rd
- 5400 Dunsmuir Rd Unit 28
- 5400 Dunsmuir Rd Unit 27
- 5400 Dunsmuir Rd Unit D
- 5400 Dunsmuir Rd Unit 25
- 5400 Dunsmuir Rd Unit 24
- 5400 Dunsmuir Rd Unit 23
- 5400 Dunsmuir Rd Unit 22
- 5400 Dunsmuir Rd Unit 21
- 5500 Dunsmuir Rd
- 5500 Dunsmuir Rd Unit 35
- 5500 Dunsmuir Rd Unit 33
- 5500 Dunsmuir Rd Unit 31
- 5500 Dunsmuir Rd Unit 30
- 5500 Dunsmuir Rd Unit 29
- 5500 Dunsmuir Rd Unit 36
- 5500 Dunsmuir Rd
- 5301 Dunsmuir Rd Unit 9
- 5301 Dunsmuir Rd Unit 10