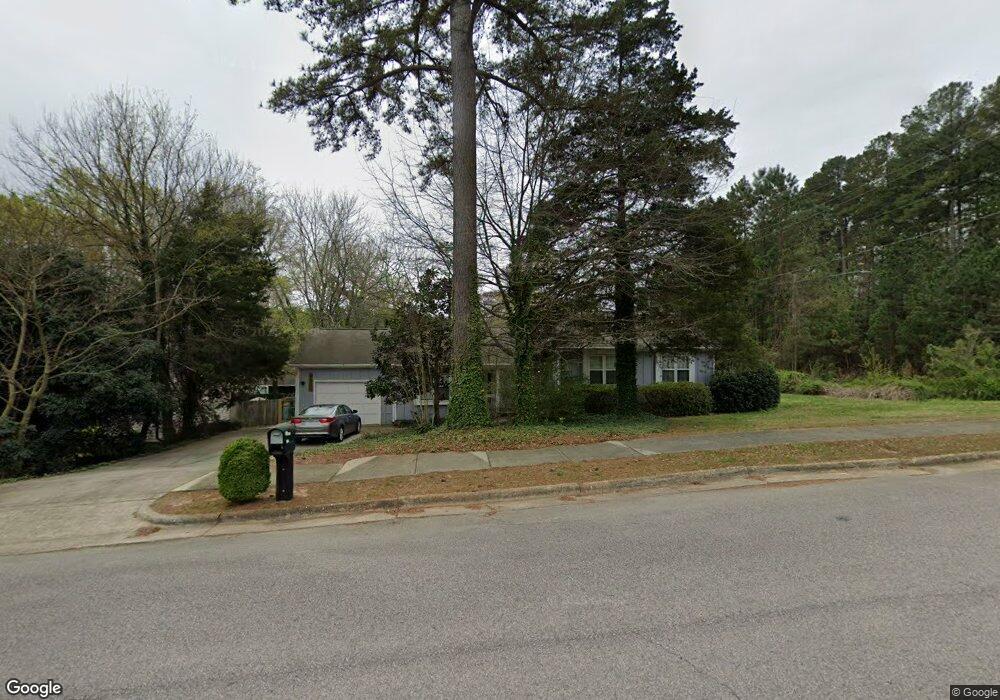
5400 Oldtowne Rd Raleigh, NC 27612
North Hills NeighborhoodEstimated Value: $491,000 - $538,000
3
Beds
2
Baths
1,540
Sq Ft
$333/Sq Ft
Est. Value
About This Home
This home is located at 5400 Oldtowne Rd, Raleigh, NC 27612 and is currently estimated at $512,996, approximately $333 per square foot. 5400 Oldtowne Rd is a home located in Wake County with nearby schools including Lynn Road Elementary School, Carroll Middle, and Sanderson High School.
Ownership History
Date
Name
Owned For
Owner Type
Purchase Details
Closed on
Feb 26, 2021
Sold by
Opendoor Property Trust I
Bought by
Cook Kelsey Marie and Cook Kelsey
Current Estimated Value
Home Financials for this Owner
Home Financials are based on the most recent Mortgage that was taken out on this home.
Original Mortgage
$332,500
Outstanding Balance
$298,063
Interest Rate
2.7%
Mortgage Type
New Conventional
Estimated Equity
$214,933
Purchase Details
Closed on
Oct 26, 2020
Sold by
Sheppard Robert G and Sheppard Tammy K
Bought by
Opendoor Property Trust I
Purchase Details
Closed on
Dec 16, 2004
Sold by
Edward B & Teruko Phillips Trust
Bought by
Sheppard Robert G and Sheppard Tammy K
Home Financials for this Owner
Home Financials are based on the most recent Mortgage that was taken out on this home.
Original Mortgage
$143,920
Interest Rate
6.75%
Mortgage Type
Fannie Mae Freddie Mac
Create a Home Valuation Report for This Property
The Home Valuation Report is an in-depth analysis detailing your home's value as well as a comparison with similar homes in the area
Home Values in the Area
Average Home Value in this Area
Purchase History
| Date | Buyer | Sale Price | Title Company |
|---|---|---|---|
| Cook Kelsey Marie | $350,000 | None Available | |
| Opendoor Property Trust I | $303,500 | None Available | |
| Sheppard Robert G | $180,000 | -- |
Source: Public Records
Mortgage History
| Date | Status | Borrower | Loan Amount |
|---|---|---|---|
| Open | Cook Kelsey Marie | $332,500 | |
| Previous Owner | Sheppard Robert G | $143,920 | |
| Closed | Sheppard Robert G | $35,980 |
Source: Public Records
Tax History Compared to Growth
Tax History
| Year | Tax Paid | Tax Assessment Tax Assessment Total Assessment is a certain percentage of the fair market value that is determined by local assessors to be the total taxable value of land and additions on the property. | Land | Improvement |
|---|---|---|---|---|
| 2025 | $4,302 | $491,027 | $200,000 | $291,027 |
| 2024 | $4,285 | $491,027 | $200,000 | $291,027 |
| 2023 | $2,994 | $272,816 | $100,000 | $172,816 |
| 2022 | $2,782 | $272,816 | $100,000 | $172,816 |
| 2021 | $2,675 | $272,816 | $100,000 | $172,816 |
| 2020 | $2,626 | $272,816 | $100,000 | $172,816 |
| 2019 | $2,793 | $239,239 | $100,000 | $139,239 |
| 2018 | $2,634 | $239,239 | $100,000 | $139,239 |
| 2017 | $2,509 | $239,239 | $100,000 | $139,239 |
| 2016 | $2,457 | $239,239 | $100,000 | $139,239 |
| 2015 | $2,162 | $206,856 | $78,000 | $128,856 |
| 2014 | $2,051 | $206,856 | $78,000 | $128,856 |
Source: Public Records
Map
Nearby Homes
- 2205 Yorkgate Dr
- 5418 Ridgeloch Place
- 5444 Pine Top Cir
- 5309 Ridgeloch Place
- 5613 Oldtowne Rd
- 1910 W Millbrook Rd
- 2237 Misskelly Dr
- 1901 Longwood Dr
- 1904 French Dr
- 5709 Hedgemoor Dr
- 5608 Bennettwood Ct
- 4831 Crestmore Rd Unit 202
- 6221 Rushingbrook Dr
- 4802 Glenmist Ct
- 2507 Princewood St
- 2510 Silverpalm St
- 5036 Isabella Cannon Dr
- 2512 Blooming St
- 1500 Shadowood Ln
- 1500 Prisma Ct
- 5400 Old Towne Rd
- 5404 Old Towne Rd
- 5404 Oldtowne Rd
- 5116 Old Towne Rd
- 5313 Thaxton Place
- 5408 Oldtowne Rd
- 5401 Oldtowne Rd
- 5312 Thaxton Place
- 5405 Oldtowne Rd
- 5405 Old Towne Rd
- 5309 Thaxton Place
- 5409 Oldtowne Rd
- 5409 Old Towne Rd
- 5412 Oldtowne Rd
- 5405 Chilham Place
- 5501 Lambshire Dr
- 5308 Thaxton Place
- 5305 Thaxton Place
- 5413 Oldtowne Rd
- 5500 Lambshire Dr