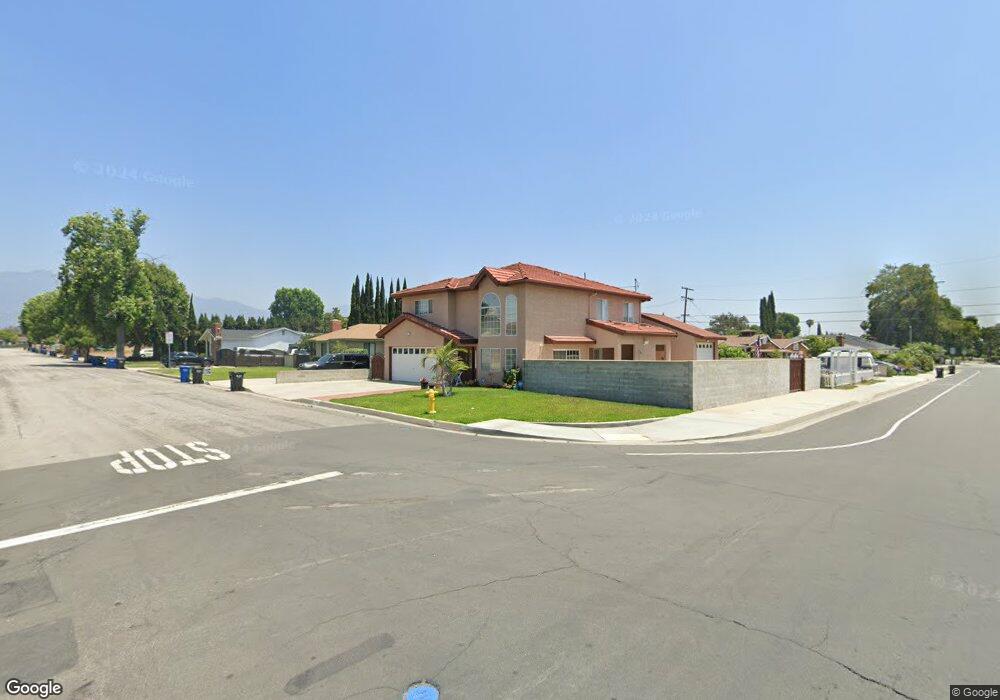
5402 Loma Ave Temple City, CA 91780
Estimated Value: $1,431,000 - $1,905,000
4
Beds
3
Baths
2,652
Sq Ft
$610/Sq Ft
Est. Value
About This Home
This home is located at 5402 Loma Ave, Temple City, CA 91780 and is currently estimated at $1,617,282, approximately $609 per square foot. 5402 Loma Ave is a home located in Los Angeles County with nearby schools including La Rosa Elementary, Oak Avenue Intermediate School, and Temple City High School.
Ownership History
Date
Name
Owned For
Owner Type
Purchase Details
Closed on
Oct 22, 2019
Sold by
Ng Hing Man and Ng Thanh Yen
Bought by
The Ng Protection Trust
Current Estimated Value
Purchase Details
Closed on
Apr 22, 1994
Sold by
California Federal Bank Fsb
Bought by
Ng Hing Man and Ng Thanh Yen
Home Financials for this Owner
Home Financials are based on the most recent Mortgage that was taken out on this home.
Original Mortgage
$155,000
Interest Rate
8.53%
Purchase Details
Closed on
Nov 30, 1993
Sold by
Cal Fed Service Corp
Bought by
California Federal Bank Fsb
Purchase Details
Closed on
Oct 22, 1993
Sold by
T D Service Company
Bought by
Security Pacific National Bank
Create a Home Valuation Report for This Property
The Home Valuation Report is an in-depth analysis detailing your home's value as well as a comparison with similar homes in the area
Home Values in the Area
Average Home Value in this Area
Purchase History
| Date | Buyer | Sale Price | Title Company |
|---|---|---|---|
| The Ng Protection Trust | -- | None Available | |
| Ng Hing Man | $265,000 | First American Title Ins Co | |
| California Federal Bank Fsb | $232,429 | Investors Title Company | |
| Security Pacific National Bank | $60,204 | Southern California Title Co |
Source: Public Records
Mortgage History
| Date | Status | Borrower | Loan Amount |
|---|---|---|---|
| Closed | Ng Hing Man | $155,000 |
Source: Public Records
Tax History Compared to Growth
Tax History
| Year | Tax Paid | Tax Assessment Tax Assessment Total Assessment is a certain percentage of the fair market value that is determined by local assessors to be the total taxable value of land and additions on the property. | Land | Improvement |
|---|---|---|---|---|
| 2025 | $5,605 | $450,557 | $217,205 | $233,352 |
| 2024 | $5,605 | $441,724 | $212,947 | $228,777 |
| 2023 | $5,480 | $433,064 | $208,772 | $224,292 |
| 2022 | $5,143 | $424,574 | $204,679 | $219,895 |
| 2021 | $5,216 | $416,250 | $200,666 | $215,584 |
| 2020 | $5,144 | $411,983 | $198,609 | $213,374 |
| 2019 | $5,033 | $403,906 | $194,715 | $209,191 |
| 2018 | $4,845 | $395,988 | $190,898 | $205,090 |
| 2016 | $4,622 | $380,613 | $183,486 | $197,127 |
| 2015 | $4,544 | $374,896 | $180,730 | $194,166 |
| 2014 | $4,481 | $367,553 | $177,190 | $190,363 |
Source: Public Records
Map
Nearby Homes
- 9134 Rancho Real Rd
- 5463 Sultana Ave
- 9409 Olive St
- 9224 Pentland St
- 5241 Rosemead Blvd Unit B
- 5530 Alessandro Ave
- 5327 Buttons Ave
- 5619 Sultana Ave Unit A
- 5635 Noel Dr
- 5143 Acacia St
- 9406 La Rosa Dr
- 4917 Encinita Ave
- 0 Sultana Ave
- 9063 Evansport Dr
- 5032 Fiesta Ave
- 5823 Myda Ave
- 4850 Heleo Ave
- 1281 E Broadway
- 8739 E Sienna Ln
- 9109 Lower Azusa Rd