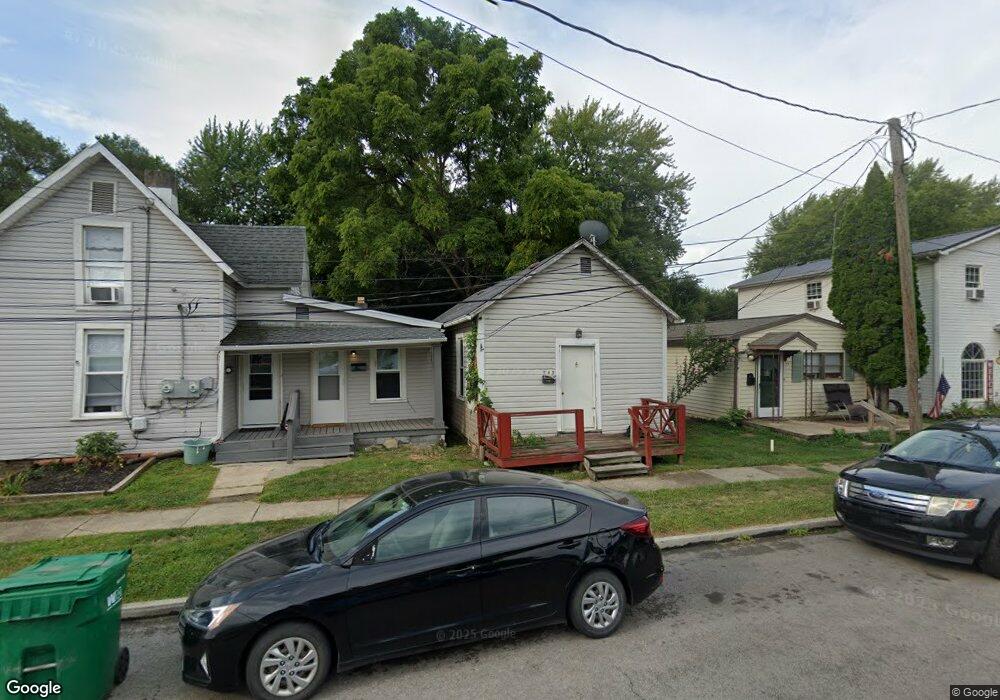
541 E Union St Circleville, OH 43113
Estimated Value: $119,000 - $146,000
2
Beds
1
Bath
768
Sq Ft
$173/Sq Ft
Est. Value
About This Home
This home is located at 541 E Union St, Circleville, OH 43113 and is currently estimated at $132,682, approximately $172 per square foot. 541 E Union St is a home located in Pickaway County with nearby schools including Circleville High School and Crossroads Christian Academy.
Ownership History
Date
Name
Owned For
Owner Type
Purchase Details
Closed on
Jul 14, 2025
Sold by
Morris Derek P and Morris Donna L
Bought by
Derek And Donna Morris Family Trust and Morris
Current Estimated Value
Purchase Details
Closed on
Feb 24, 2005
Sold by
Sowers Rosa Lee
Bought by
Morris Derek P and Morris Donna L
Home Financials for this Owner
Home Financials are based on the most recent Mortgage that was taken out on this home.
Original Mortgage
$38,700
Interest Rate
5.71%
Mortgage Type
Purchase Money Mortgage
Purchase Details
Closed on
Oct 16, 1997
Sold by
Rosa L Sowers
Bought by
Larry F Rogers and Paul D
Home Financials for this Owner
Home Financials are based on the most recent Mortgage that was taken out on this home.
Original Mortgage
$50,000
Interest Rate
7.65%
Mortgage Type
New Conventional
Purchase Details
Closed on
Feb 5, 1993
Sold by
Baxter Michael J
Bought by
Sowers Rosa Lee
Purchase Details
Closed on
Feb 1, 1992
Purchase Details
Closed on
Apr 29, 1991
Sold by
Baxter Michael J
Bought by
Baxter Michael J
Create a Home Valuation Report for This Property
The Home Valuation Report is an in-depth analysis detailing your home's value as well as a comparison with similar homes in the area
Home Values in the Area
Average Home Value in this Area
Purchase History
| Date | Buyer | Sale Price | Title Company |
|---|---|---|---|
| Derek And Donna Morris Family Trust | -- | None Listed On Document | |
| Morris Derek P | $43,000 | Clt | |
| Larry F Rogers | $7,500 | -- | |
| Sowers Rosa Lee | $31,000 | -- | |
| -- | $31,000 | -- | |
| Baxter Michael J | -- | -- |
Source: Public Records
Mortgage History
| Date | Status | Borrower | Loan Amount |
|---|---|---|---|
| Previous Owner | Morris Derek P | $38,700 | |
| Previous Owner | Larry F Rogers | $50,000 |
Source: Public Records
Tax History
| Year | Tax Paid | Tax Assessment Tax Assessment Total Assessment is a certain percentage of the fair market value that is determined by local assessors to be the total taxable value of land and additions on the property. | Land | Improvement |
|---|---|---|---|---|
| 2025 | $1,952 | $25,770 | $2,330 | $23,440 |
| 2024 | $1,952 | $25,770 | $2,330 | $23,440 |
| 2023 | $929 | $25,770 | $2,330 | $23,440 |
| 2022 | $924 | $20,360 | $1,950 | $18,410 |
| 2021 | $930 | $20,360 | $1,950 | $18,410 |
| 2020 | $930 | $20,360 | $1,950 | $18,410 |
| 2019 | $840 | $17,540 | $1,950 | $15,590 |
| 2018 | $880 | $17,540 | $1,950 | $15,590 |
| 2017 | $873 | $17,540 | $1,950 | $15,590 |
| 2016 | $813 | $16,080 | $2,140 | $13,940 |
| 2015 | $814 | $16,080 | $2,140 | $13,940 |
| 2014 | $811 | $16,080 | $2,140 | $13,940 |
| 2013 | $895 | $17,470 | $2,140 | $15,330 |
Source: Public Records
Map
Nearby Homes
- 575 Renick Ave
- 528 E Ohio St
- 446 E Franklin St
- 531 E Franklin St
- 551 E Main St
- 378 E Franklin St
- 461 Watt St
- 405 Watt St
- 207 E Mill St
- 837 Clinton St
- 321 S Pickaway St
- 416 Stella Ave
- 125 N Pickaway St
- 348 Walnut St
- 1234 Williams Dr
- 231 Westwood Dr
- 180 Nicholas Dr
- 339 Walnut St
- 134 Fairview Blvd
- 0 Ohio 56 Unit 226002334
Your Personal Tour Guide
Ask me questions while you tour the home.