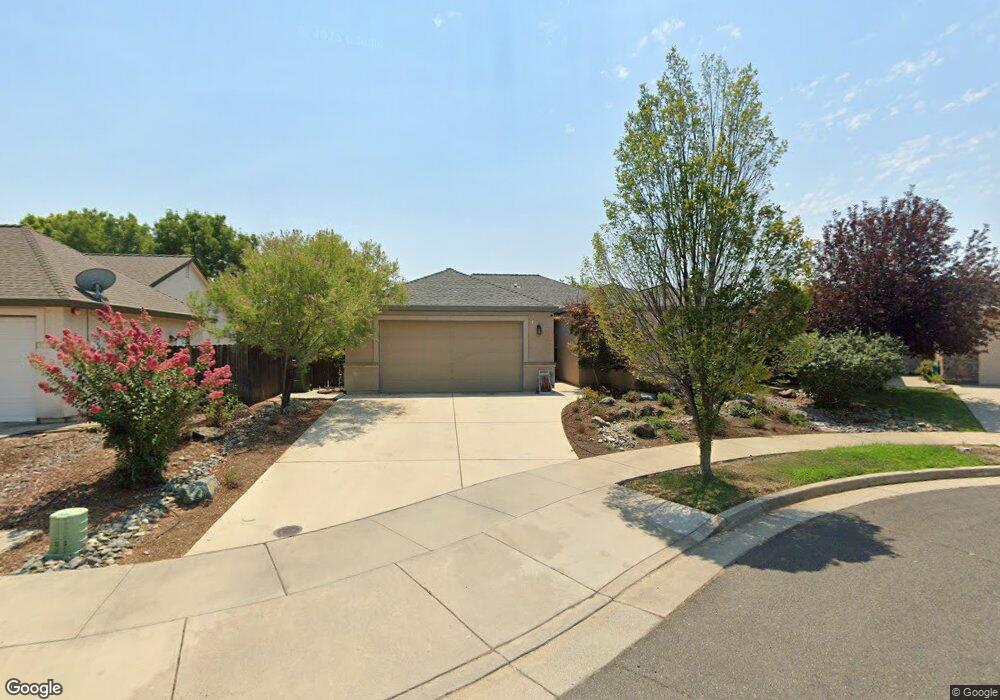
541 Grants Pass Place Redding, CA 96003
Tanglewood NeighborhoodEstimated Value: $407,000 - $428,000
3
Beds
2
Baths
1,462
Sq Ft
$285/Sq Ft
Est. Value
About This Home
This home is located at 541 Grants Pass Place, Redding, CA 96003 and is currently estimated at $416,150, approximately $284 per square foot. 541 Grants Pass Place is a home located in Shasta County with nearby schools including Boulder Creek Elementary School, Enterprise High School, and Country Christian School.
Ownership History
Date
Name
Owned For
Owner Type
Purchase Details
Closed on
Jul 9, 2013
Sold by
Sisneros Carrie L
Bought by
Sisneros Carrie L
Current Estimated Value
Home Financials for this Owner
Home Financials are based on the most recent Mortgage that was taken out on this home.
Original Mortgage
$186,000
Outstanding Balance
$137,229
Interest Rate
4.27%
Mortgage Type
New Conventional
Estimated Equity
$278,921
Purchase Details
Closed on
Nov 13, 2012
Sold by
J&S Highland Park Llc
Bought by
S&J Development Inc
Purchase Details
Closed on
May 17, 2010
Sold by
S&J Development Inc
Bought by
Sisneros Carrie L
Home Financials for this Owner
Home Financials are based on the most recent Mortgage that was taken out on this home.
Original Mortgage
$185,600
Interest Rate
5.21%
Mortgage Type
New Conventional
Purchase Details
Closed on
May 13, 2010
Sold by
Sisneros Eric L
Bought by
Sisneros Carrie L
Home Financials for this Owner
Home Financials are based on the most recent Mortgage that was taken out on this home.
Original Mortgage
$185,600
Interest Rate
5.21%
Mortgage Type
New Conventional
Create a Home Valuation Report for This Property
The Home Valuation Report is an in-depth analysis detailing your home's value as well as a comparison with similar homes in the area
Home Values in the Area
Average Home Value in this Area
Purchase History
| Date | Buyer | Sale Price | Title Company |
|---|---|---|---|
| Sisneros Carrie L | -- | Lsi Title Company | |
| S&J Development Inc | -- | Placer Title Company | |
| Sisneros Carrie L | $232,000 | Placer Title Company | |
| Sisneros Carrie L | -- | Placer Title Company |
Source: Public Records
Mortgage History
| Date | Status | Borrower | Loan Amount |
|---|---|---|---|
| Open | Sisneros Carrie L | $186,000 | |
| Previous Owner | Sisneros Carrie L | $185,600 | |
| Previous Owner | Sisneros Carrie L | $11,600 |
Source: Public Records
Tax History
| Year | Tax Paid | Tax Assessment Tax Assessment Total Assessment is a certain percentage of the fair market value that is determined by local assessors to be the total taxable value of land and additions on the property. | Land | Improvement |
|---|---|---|---|---|
| 2025 | $3,501 | $299,456 | $64,533 | $234,923 |
| 2024 | $3,479 | $293,585 | $63,268 | $230,317 |
| 2023 | $3,479 | $287,829 | $62,028 | $225,801 |
| 2022 | $3,381 | $282,186 | $60,812 | $221,374 |
| 2021 | $3,250 | $276,654 | $59,620 | $217,034 |
| 2020 | $3,188 | $273,818 | $59,009 | $214,809 |
| 2019 | $3,107 | $268,450 | $57,852 | $210,598 |
| 2018 | $3,048 | $263,187 | $56,718 | $206,469 |
| 2017 | $3,097 | $258,027 | $55,606 | $202,421 |
| 2016 | $2,785 | $252,968 | $54,516 | $198,452 |
| 2015 | $2,699 | $249,170 | $53,698 | $195,472 |
| 2014 | $2,932 | $244,290 | $52,647 | $191,643 |
Source: Public Records
Map
Nearby Homes
- 651 Mission de Oro Dr
- 592 Mill Valley Pkwy
- 771 Flower Ash Ln
- 856 Mission de Oro Dr
- 531 Fair Hill Dr
- 825 Mission Sierra Ct
- 707 Alamine Dr
- 667 Reddington Dr
- 639 Alamine Dr
- 720 Stonebriar Trail
- 775 Stonebriar Trail
- 1026 Palisades Ave
- 724 Oakhurst Trail
- 790 Volcano View Trail
- 454 Alamine Dr
- 1088 Burton Dr
- 1285 Lancers Ln
- 225 Ridgetop Dr Unit 214
- 11037 Erickson Way
- 488 Ridgecrest Trail Unit 133
- 541 Grants Pass
- 559 Grants Pass Place
- 577 Grants Pass Place
- 559 Grants Pass
- 523 Grants Pass Place
- 523 Grants Pass
- 898 Domain Way
- 505 Grants Pass Place
- 930 Domain Way
- 886 Domain Way
- 577 Grants Pass
- 505 Grants Pass
- 526 Grants Pass Place
- 960 Domain Way
- 874 Domain Way
- 544 Grants Pass
- 508 Grants Pass
- 508 Grants Pass
- 526 Grants Pass
- 595 Grants Pass Place
Your Personal Tour Guide
Ask me questions while you tour the home.