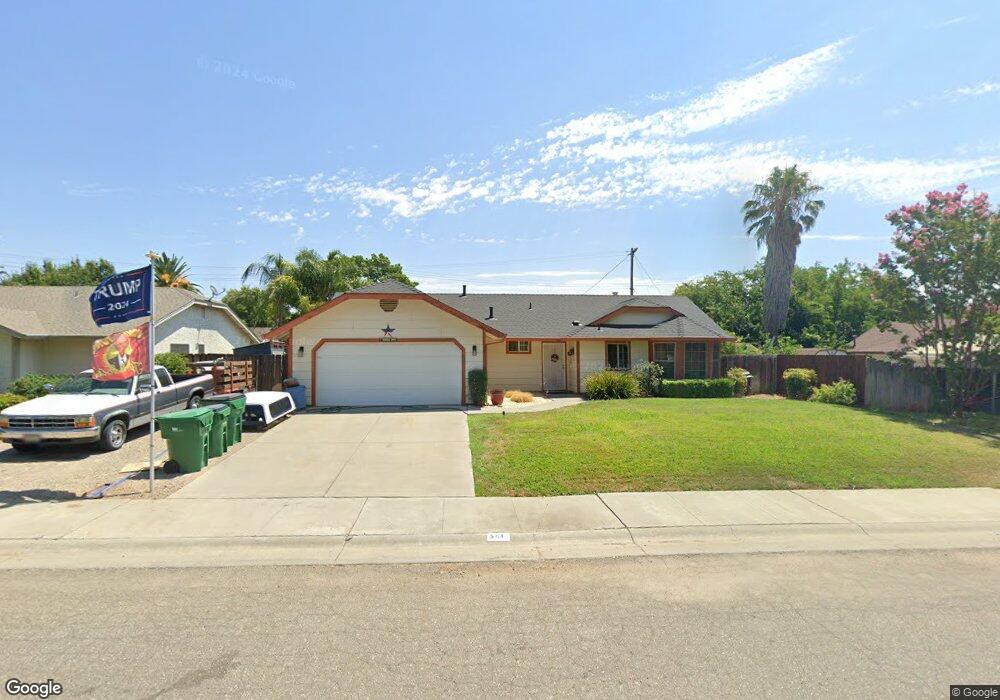
541 Hyland Dr Corning, CA 96021
Estimated Value: $268,000 - $370,000
3
Beds
2
Baths
1,355
Sq Ft
$228/Sq Ft
Est. Value
About This Home
This home is located at 541 Hyland Dr, Corning, CA 96021 and is currently estimated at $308,613, approximately $227 per square foot. 541 Hyland Dr is a home located in Tehama County with nearby schools including Olive View Elementary School, Maywood Middle School, and Corning High School.
Ownership History
Date
Name
Owned For
Owner Type
Purchase Details
Closed on
Jan 29, 2014
Sold by
Neill Robert Raymond O and Neill Marlene Marie O
Bought by
Johnson Elizzabeth and Johnson Mark
Current Estimated Value
Home Financials for this Owner
Home Financials are based on the most recent Mortgage that was taken out on this home.
Original Mortgage
$106,400
Outstanding Balance
$56,378
Interest Rate
4.45%
Mortgage Type
New Conventional
Estimated Equity
$252,235
Purchase Details
Closed on
Dec 30, 2002
Sold by
Oneill Robert Raymond
Bought by
Oneill Robert Raymond and Oneill Marlene Marie
Create a Home Valuation Report for This Property
The Home Valuation Report is an in-depth analysis detailing your home's value as well as a comparison with similar homes in the area
Purchase History
| Date | Buyer | Sale Price | Title Company |
|---|---|---|---|
| Johnson Elizzabeth | $133,000 | Northern California Title Co | |
| Oneill Robert Raymond | -- | -- |
Source: Public Records
Mortgage History
| Date | Status | Borrower | Loan Amount |
|---|---|---|---|
| Open | Johnson Elizzabeth | $106,400 |
Source: Public Records
Tax History
| Year | Tax Paid | Tax Assessment Tax Assessment Total Assessment is a certain percentage of the fair market value that is determined by local assessors to be the total taxable value of land and additions on the property. | Land | Improvement |
|---|---|---|---|---|
| 2025 | $1,824 | $183,867 | $42,900 | $140,967 |
| 2023 | $1,788 | $176,729 | $41,235 | $135,494 |
| 2022 | $1,762 | $173,265 | $40,427 | $132,838 |
| 2021 | $1,695 | $169,869 | $39,635 | $130,234 |
| 2020 | $1,712 | $168,128 | $39,229 | $128,899 |
| 2019 | $1,640 | $164,832 | $38,460 | $126,372 |
| 2018 | $1,641 | $161,601 | $37,706 | $123,895 |
| 2017 | $1,629 | $158,433 | $36,967 | $121,466 |
| 2016 | $1,517 | $155,328 | $36,243 | $119,085 |
| 2015 | $1,508 | $152,996 | $35,699 | $117,297 |
| 2014 | $1,109 | $107,000 | $30,000 | $77,000 |
Source: Public Records
Map
Nearby Homes
- 537 Hyland Dr
- 566 Marguerite Ave
- 310 Divisidero Ave
- 590 Marguerite Ave
- 526 Marguerite Ave
- 542 Hyland Dr
- 554 Hyland Dr
- 525 Hyland Dr
- 538 Hyland Dr
- 570 Hyland Dr
- 315 Colusa St
- 526 Hyland Dr
- 588 Hyland Dr
- 541 Stanmar Dr
- 575 Marguerite Ave
- 553 Stanmar Dr
- 565 Marguerite Ave
- 537 Stanmar Dr
- 630 Marguerite Ave
- 585 Marguerite Ave
Your Personal Tour Guide
Ask me questions while you tour the home.