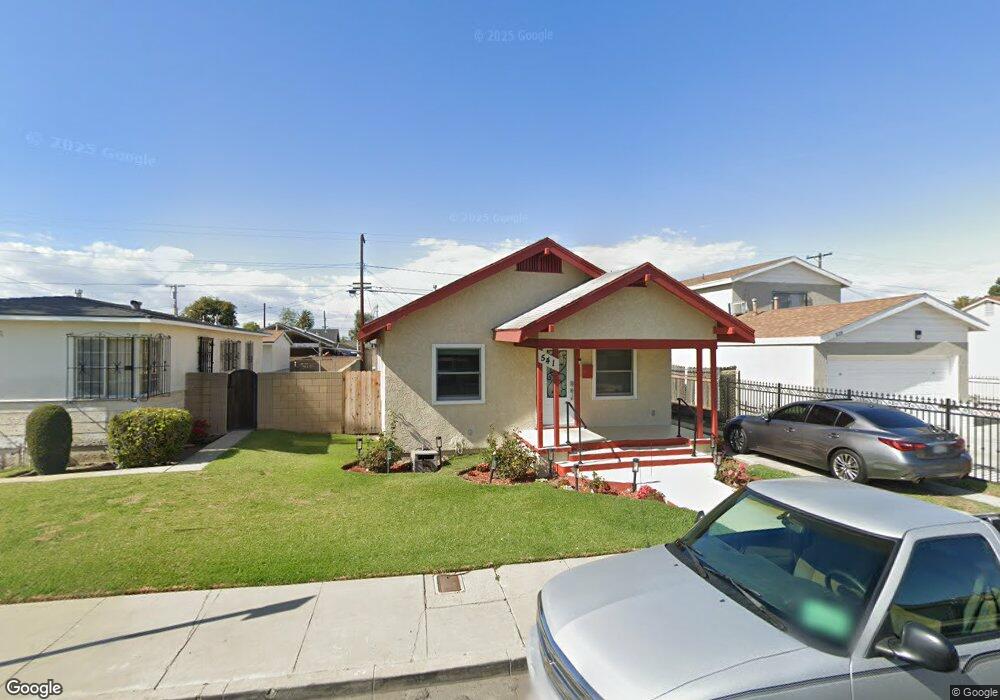
541 W Cressey St Compton, CA 90222
Estimated Value: $291,000 - $617,000
2
Beds
1
Bath
768
Sq Ft
$571/Sq Ft
Est. Value
About This Home
This home is located at 541 W Cressey St, Compton, CA 90222 and is currently estimated at $438,738, approximately $571 per square foot. 541 W Cressey St is a home located in Los Angeles County with nearby schools including Washington Elementary School, Benjamin O. Davis Middle School, and Compton High School.
Ownership History
Date
Name
Owned For
Owner Type
Purchase Details
Closed on
Feb 12, 2019
Sold by
Ward Nemiaya Lewis
Bought by
Ward Nemiaya Lewis
Current Estimated Value
Home Financials for this Owner
Home Financials are based on the most recent Mortgage that was taken out on this home.
Original Mortgage
$133,000
Outstanding Balance
$116,692
Interest Rate
4.4%
Mortgage Type
Construction
Estimated Equity
$322,046
Purchase Details
Closed on
Oct 16, 2017
Sold by
Ward Pamela
Bought by
Ward Nemiaya Lewis
Purchase Details
Closed on
Jun 9, 2012
Sold by
Ward Pamela
Bought by
Ward Pamela
Home Financials for this Owner
Home Financials are based on the most recent Mortgage that was taken out on this home.
Original Mortgage
$168,000
Interest Rate
3.77%
Mortgage Type
New Conventional
Purchase Details
Closed on
Apr 1, 1999
Sold by
Ward Roy E
Bought by
Ward Pamela
Create a Home Valuation Report for This Property
The Home Valuation Report is an in-depth analysis detailing your home's value as well as a comparison with similar homes in the area
Home Values in the Area
Average Home Value in this Area
Purchase History
| Date | Buyer | Sale Price | Title Company |
|---|---|---|---|
| Ward Nemiaya Lewis | -- | Lawyers Title | |
| Ward Nemiaya Lewis | -- | None Available | |
| Ward Pamela | -- | Calcounties Title Nation | |
| Ward Pamela | -- | Calcounties Title Nation | |
| Ward Pamela | -- | -- |
Source: Public Records
Mortgage History
| Date | Status | Borrower | Loan Amount |
|---|---|---|---|
| Open | Ward Nemiaya Lewis | $133,000 | |
| Closed | Ward Pamela | $168,000 |
Source: Public Records
Tax History
| Year | Tax Paid | Tax Assessment Tax Assessment Total Assessment is a certain percentage of the fair market value that is determined by local assessors to be the total taxable value of land and additions on the property. | Land | Improvement |
|---|---|---|---|---|
| 2025 | $1,116 | $15,860 | $7,071 | $8,789 |
| 2024 | $1,116 | $15,550 | $6,933 | $8,617 |
| 2023 | $1,093 | $15,247 | $6,798 | $8,449 |
| 2022 | $743 | $14,949 | $6,665 | $8,284 |
| 2021 | $740 | $14,657 | $6,535 | $8,122 |
| 2019 | $5,516 | $311,100 | $204,000 | $107,100 |
| 2018 | $660 | $13,946 | $6,218 | $7,728 |
| 2016 | $631 | $13,407 | $5,978 | $7,429 |
| 2015 | $616 | $13,207 | $5,889 | $7,318 |
| 2014 | $618 | $12,949 | $5,774 | $7,175 |
Source: Public Records
Map
Nearby Homes
- 521 W Cherry St
- 629 W Plum St
- 522 W Cherry St
- 701 W 139th St
- 720 W Cherry St
- 2062 E Hatchway St
- 720 W 137th St
- 1608 N Grape Ave
- 418 W Spruce St
- 348 W Peach St
- 806 W Spruce St
- 814 W Maple St
- 2223 E Oris St
- 2107 E Stockwell St
- 1808 N Grape Ave
- 905 N Hickory Ave
- 2102 E Lucien St
- 836 W Cedar St
- 910 W 138th St
- 813 W Stockwell St
- 539 W Cressey St
- 545 W Cressey St
- 535 W Cressey St
- 540 W Peach St
- 544 W Peach St
- 534 W Peach St
- 1314 N Matthisen Ave
- 529 W Cressey St
- 601 W Cressey St
- 538 W Cressey St
- 536 W Cressey St
- 528 W Peach St
- 532 W Cressey St
- 600 W Peach St
- 1312 N Matthisen Ave
- 527 W Cressey St
- 600 W Cressey St
- 530 W Cressey St
- 526 W Peach St
- 607 W Cressey St
Your Personal Tour Guide
Ask me questions while you tour the home.