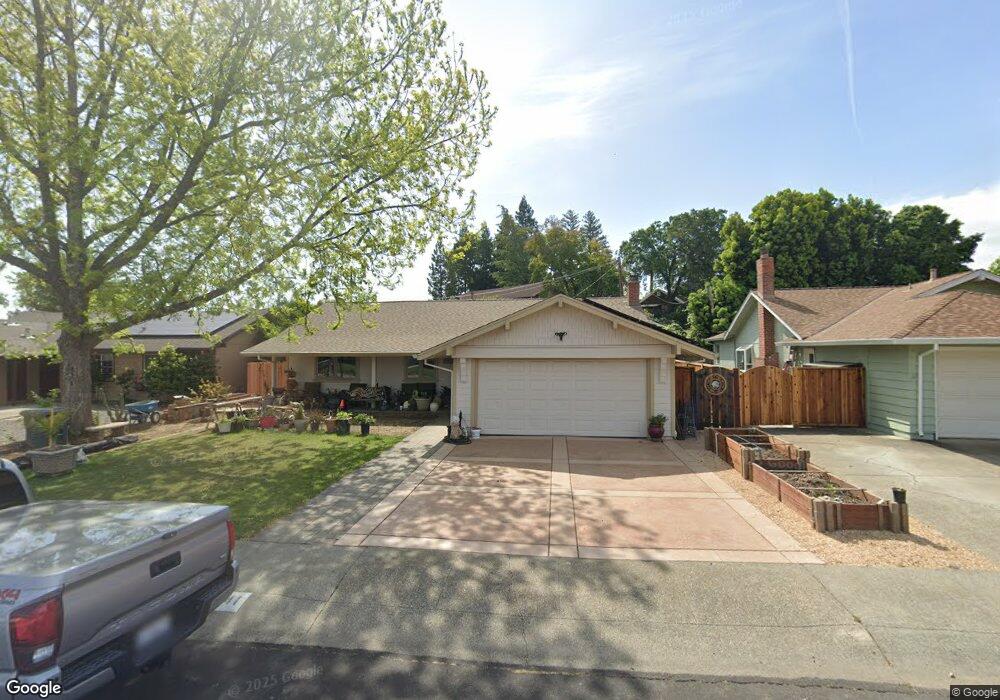
541 Werner Way Vacaville, CA 95688
Estimated Value: $501,000 - $548,000
3
Beds
2
Baths
1,329
Sq Ft
$397/Sq Ft
Est. Value
About This Home
This home is located at 541 Werner Way, Vacaville, CA 95688 and is currently estimated at $527,419, approximately $396 per square foot. 541 Werner Way is a home located in Solano County with nearby schools including Alamo Elementary School, Orchard Elementary School, and Willis Jepson Middle School.
Ownership History
Date
Name
Owned For
Owner Type
Purchase Details
Closed on
Jun 5, 2017
Sold by
Solomon Eric S
Bought by
Jacobo Hilda M and Martinez Eli J Jacobo
Current Estimated Value
Home Financials for this Owner
Home Financials are based on the most recent Mortgage that was taken out on this home.
Original Mortgage
$297,000
Outstanding Balance
$247,110
Interest Rate
4.03%
Mortgage Type
New Conventional
Estimated Equity
$280,309
Purchase Details
Closed on
Sep 25, 2006
Sold by
Solomon Robert L
Bought by
Solomon Robert L
Home Financials for this Owner
Home Financials are based on the most recent Mortgage that was taken out on this home.
Original Mortgage
$311,500
Interest Rate
6.53%
Mortgage Type
New Conventional
Purchase Details
Closed on
Nov 12, 2002
Sold by
Solomon Robert L
Bought by
Solomon Robert L
Create a Home Valuation Report for This Property
The Home Valuation Report is an in-depth analysis detailing your home's value as well as a comparison with similar homes in the area
Purchase History
| Date | Buyer | Sale Price | Title Company |
|---|---|---|---|
| Jacobo Hilda M | $330,000 | Placer Title Company | |
| Solomon Robert L | -- | Chicago Title Co | |
| Solomon Robert L | -- | Chicago Title Co | |
| Solomon Robert L | -- | North American Title Co |
Source: Public Records
Mortgage History
| Date | Status | Borrower | Loan Amount |
|---|---|---|---|
| Open | Jacobo Hilda M | $297,000 | |
| Previous Owner | Solomon Robert L | $311,500 |
Source: Public Records
Tax History
| Year | Tax Paid | Tax Assessment Tax Assessment Total Assessment is a certain percentage of the fair market value that is determined by local assessors to be the total taxable value of land and additions on the property. | Land | Improvement |
|---|---|---|---|---|
| 2025 | $4,806 | $417,804 | $92,843 | $324,961 |
| 2024 | $4,806 | $409,613 | $91,023 | $318,590 |
| 2023 | $4,693 | $401,583 | $89,239 | $312,344 |
| 2022 | $4,571 | $393,710 | $87,490 | $306,220 |
| 2021 | $4,580 | $385,991 | $85,775 | $300,216 |
| 2020 | $4,519 | $382,034 | $84,896 | $297,138 |
| 2019 | $4,441 | $374,544 | $83,232 | $291,312 |
| 2018 | $4,392 | $367,200 | $81,600 | $285,600 |
| 2017 | $2,251 | $190,387 | $58,579 | $131,808 |
| 2016 | $2,234 | $186,655 | $57,431 | $129,224 |
| 2015 | $2,206 | $183,852 | $56,569 | $127,283 |
| 2014 | $2,067 | $180,251 | $55,461 | $124,790 |
Source: Public Records
Map
Nearby Homes
- 491 Buck Ave
- 456 Lovers Ln
- 569 Alamo Dr
- 366 Peach Tree Ave
- 459 Meadowview Dr
- 729 Brookside Dr
- 751 El Camino Ave
- 620 Walnut Ave
- 456 Buckeye St
- 476 Cottonwood St
- 149 Fairoaks Dr
- 179 Wykoff Dr
- 124 Wykoff Dr
- 0 Merchant St Unit 325089259
- 239 Deodara St
- 149 Mason St
- 162 N Alamo Dr
- 317 Grape St
- 300 Butcher Rd
- 0 Parker St Unit 324045416
- 521 Werner Way
- 561 Werner Way
- 501 Werner Way
- 550 Nottingham Dr
- 360 S Orchard Ave
- 560 Nottingham Dr
- 571 Werner Way
- 540 Werner Way
- 520 Werner Way
- 348 S Orchard Ave
- 366 S Orchard Ave
- 570 Nottingham Dr
- 560 Werner Way
- 342 S Orchard Ave
- 372 S Orchard Ave
- 336 S Orchard Ave
- 580 Nottingham Dr
- 355 S Orchard Ave
- 591 Werner Way
- 349 S Orchard Ave
Your Personal Tour Guide
Ask me questions while you tour the home.