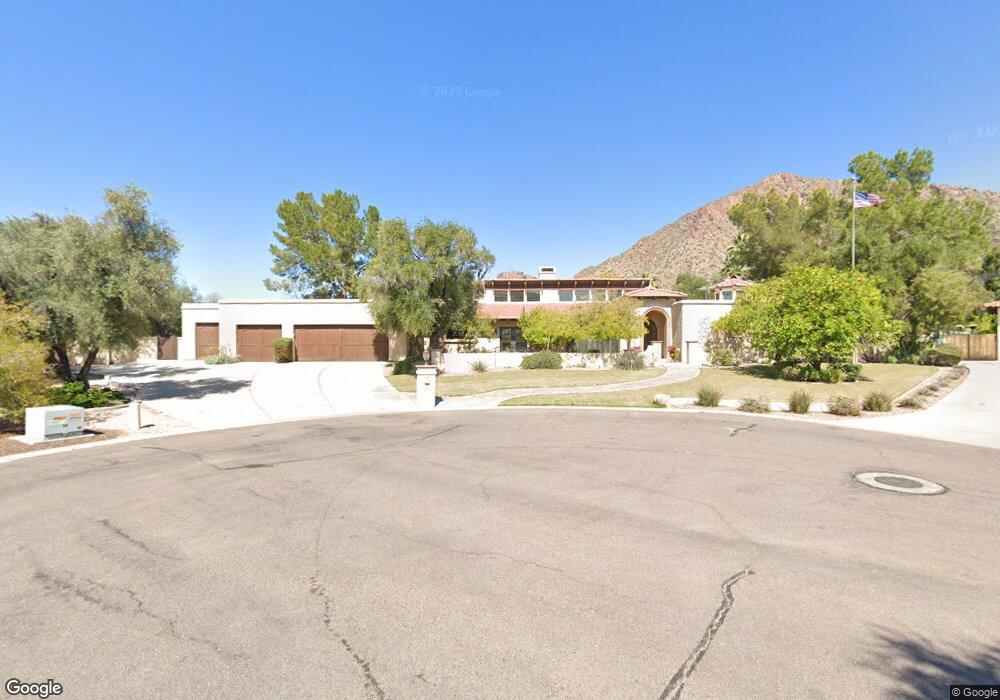
5410 E Camelhill Rd Unit 62 Phoenix, AZ 85018
Camelback East Village NeighborhoodEstimated Value: $236,000 - $293,000
Studio
2
Baths
1,288
Sq Ft
$209/Sq Ft
Est. Value
About This Home
This home is located at 5410 E Camelhill Rd Unit 62, Phoenix, AZ 85018 and is currently estimated at $269,204, approximately $209 per square foot. 5410 E Camelhill Rd Unit 62 is a home located in Maricopa County with nearby schools including Hopi Elementary School, Ingleside Middle School, and Arcadia High School.
Ownership History
Date
Name
Owned For
Owner Type
Purchase Details
Closed on
Apr 14, 2021
Sold by
Phillips William T and Phillips Connie D
Bought by
Doffing Thomas P and Doffing Deb J
Current Estimated Value
Home Financials for this Owner
Home Financials are based on the most recent Mortgage that was taken out on this home.
Original Mortgage
$137,000
Outstanding Balance
$123,694
Interest Rate
3%
Mortgage Type
New Conventional
Estimated Equity
$145,510
Purchase Details
Closed on
Jun 14, 2012
Sold by
Roshek Steven J and Roshek Sharon
Bought by
Phillips William T and Phillips Connie D
Purchase Details
Closed on
Jun 26, 2006
Sold by
Phillips William T and Phillips Connie D
Bought by
Roshek Steven J and Roshek Sharon
Home Financials for this Owner
Home Financials are based on the most recent Mortgage that was taken out on this home.
Original Mortgage
$136,000
Interest Rate
6.57%
Mortgage Type
Seller Take Back
Create a Home Valuation Report for This Property
The Home Valuation Report is an in-depth analysis detailing your home's value as well as a comparison with similar homes in the area
Home Values in the Area
Average Home Value in this Area
Purchase History
| Date | Buyer | Sale Price | Title Company |
|---|---|---|---|
| Doffing Thomas P | $177,000 | Title Alliance Of Az Agcy Ll | |
| Phillips William T | -- | First American Title Ins Co | |
| Roshek Steven J | $170,000 | First American Title Insuran |
Source: Public Records
Mortgage History
| Date | Status | Borrower | Loan Amount |
|---|---|---|---|
| Open | Doffing Thomas P | $137,000 | |
| Previous Owner | Roshek Steven J | $136,000 |
Source: Public Records
Tax History
| Year | Tax Paid | Tax Assessment Tax Assessment Total Assessment is a certain percentage of the fair market value that is determined by local assessors to be the total taxable value of land and additions on the property. | Land | Improvement |
|---|---|---|---|---|
| 2025 | $847 | $14,285 | -- | -- |
| 2024 | $1,200 | $13,605 | -- | -- |
| 2023 | $1,200 | $17,170 | $3,430 | $13,740 |
| 2022 | $1,174 | $13,770 | $2,750 | $11,020 |
| 2021 | $1,207 | $12,150 | $2,430 | $9,720 |
| 2020 | $1,385 | $11,270 | $2,250 | $9,020 |
| 2019 | $1,294 | $10,660 | $2,130 | $8,530 |
| 2018 | $1,287 | $10,520 | $2,100 | $8,420 |
| 2017 | $1,275 | $10,230 | $2,040 | $8,190 |
| 2016 | $1,297 | $10,100 | $2,020 | $8,080 |
| 2015 | $1,259 | $10,280 | $2,050 | $8,230 |
Source: Public Records
Map
Nearby Homes
- 4545 N Royal View Dr E
- 4545 N Royal View Dr E Unit 8
- 5310 E Camelback Rd
- 5501 E Camelback Rd
- 5401 E Mariposa St
- 4600 N Rubicon Ave Unit 2
- 4550 N Rubicon Ave Unit 1
- 5402 E Exeter Blvd
- 5446 E Exeter Blvd
- 5518 E Rockridge Rd
- 4725 N 56th St
- 5630 E Rockridge Rd
- 5654 E Mesquite Ln
- 5414 E Lafayette Blvd
- 5627 E Monterosa St
- 4535 N 49th Place
- 4425 N Arcadia Ln
- 4030 N 54th Place
- 5715 E Monterosa St
- 5521 E Lafayette Blvd
- 5410 E Camelhill Rd Unit 80
- 5410 E Camelhill Rd Unit 55
- 5410 E Camelhill Rd Unit 49
- 5410 E Camelhill Rd Unit 47
- 5410 E Camelhill Rd
- 4529 N 54th St
- 5418 E Camelhill Rd
- 5409 E Camelhill Rd
- 5409 E Camello Rd
- 5409 E Camello Rd
- 4545 N 54th St
- 5421 E Camello Rd
- 5323 E Royal View Dr S
- 5323 E Royal View Dr S Unit 9
- 5415 E Camelhill Rd
- 5424 E Camelhill Rd
- 5431 E Camello Rd
- 5338 E Camelback Rd
- 5402 E Camelback Rd
- 4510 N 54th St
Your Personal Tour Guide
Ask me questions while you tour the home.