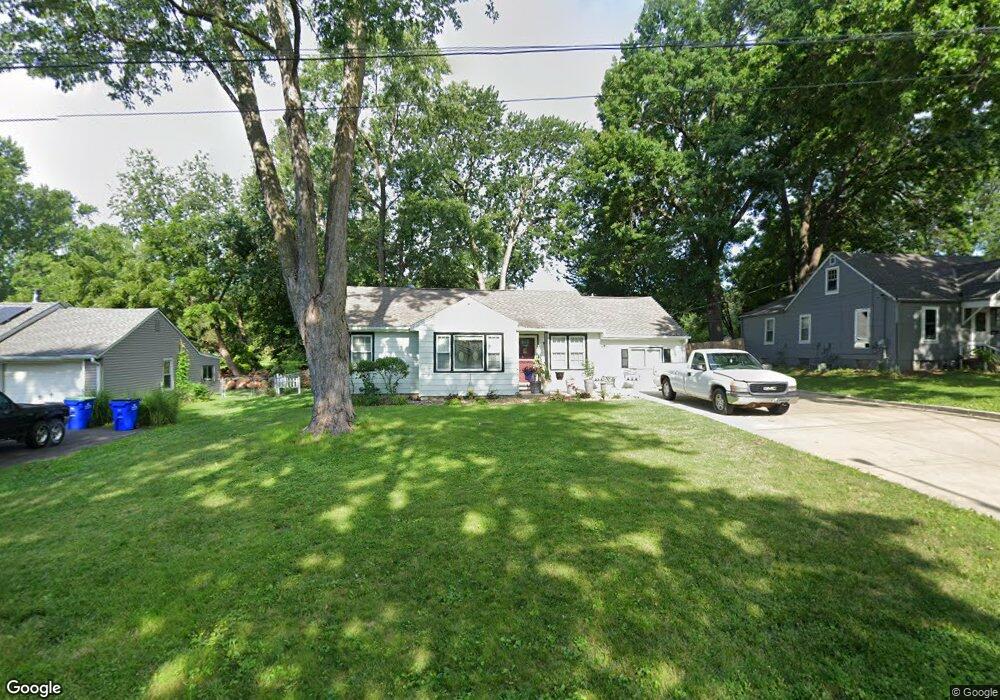
5412 Halsey St Shawnee, KS 66216
Estimated Value: $286,000 - $308,000
4
Beds
2
Baths
1,410
Sq Ft
$213/Sq Ft
Est. Value
About This Home
This home is located at 5412 Halsey St, Shawnee, KS 66216 and is currently estimated at $300,749, approximately $213 per square foot. 5412 Halsey St is a home located in Johnson County with nearby schools including Ray Marsh Elementary School, Trailridge Middle School, and Shawnee Mission Northwest High School.
Ownership History
Date
Name
Owned For
Owner Type
Purchase Details
Closed on
Apr 8, 2005
Sold by
Outlook Inc
Bought by
Johnson Kenneth E
Current Estimated Value
Home Financials for this Owner
Home Financials are based on the most recent Mortgage that was taken out on this home.
Original Mortgage
$106,000
Outstanding Balance
$54,700
Interest Rate
5.78%
Mortgage Type
New Conventional
Estimated Equity
$246,049
Purchase Details
Closed on
Mar 25, 2005
Sold by
Hensley Matt and Hensley Tammy
Bought by
Outlook Inc
Home Financials for this Owner
Home Financials are based on the most recent Mortgage that was taken out on this home.
Original Mortgage
$106,000
Outstanding Balance
$54,700
Interest Rate
5.78%
Mortgage Type
New Conventional
Estimated Equity
$246,049
Purchase Details
Closed on
Sep 26, 2003
Sold by
Reilly Tamara J
Bought by
Hensley Matthew S and Hensley Tammy L
Home Financials for this Owner
Home Financials are based on the most recent Mortgage that was taken out on this home.
Original Mortgage
$122,400
Interest Rate
6.24%
Mortgage Type
Purchase Money Mortgage
Create a Home Valuation Report for This Property
The Home Valuation Report is an in-depth analysis detailing your home's value as well as a comparison with similar homes in the area
Home Values in the Area
Average Home Value in this Area
Purchase History
| Date | Buyer | Sale Price | Title Company |
|---|---|---|---|
| Johnson Kenneth E | -- | Kansas Secured Title | |
| Outlook Inc | -- | None Available | |
| Hensley Matthew S | -- | Security Land Title Company |
Source: Public Records
Mortgage History
| Date | Status | Borrower | Loan Amount |
|---|---|---|---|
| Open | Johnson Kenneth E | $106,000 | |
| Previous Owner | Hensley Matthew S | $122,400 |
Source: Public Records
Tax History Compared to Growth
Tax History
| Year | Tax Paid | Tax Assessment Tax Assessment Total Assessment is a certain percentage of the fair market value that is determined by local assessors to be the total taxable value of land and additions on the property. | Land | Improvement |
|---|---|---|---|---|
| 2024 | $2,957 | $28,221 | $7,414 | $20,807 |
| 2023 | $2,956 | $27,635 | $6,744 | $20,891 |
| 2022 | $2,873 | $26,749 | $6,121 | $20,628 |
| 2021 | $2,873 | $23,356 | $5,323 | $18,033 |
| 2020 | $2,623 | $22,518 | $4,842 | $17,676 |
| 2019 | $2,309 | $19,780 | $4,613 | $15,167 |
| 2018 | $2,202 | $18,791 | $4,613 | $14,178 |
| 2017 | $2,094 | $17,583 | $4,195 | $13,388 |
| 2016 | $2,014 | $16,686 | $4,195 | $12,491 |
| 2015 | $1,819 | $15,743 | $4,195 | $11,548 |
| 2013 | -- | $14,973 | $4,195 | $10,778 |
Source: Public Records
Map
Nearby Homes
- 5407 Halsey St
- 5504 Monrovia St
- 11815 W 53rd St
- 13126 W 52nd Terrace
- 13134 W 52nd Terrace
- 13130 W 52nd Terrace
- 12508 W 56th St
- 11403 W 51st Terrace
- 5308 Mcanany Dr
- 5845 Caenen St
- 13305 W 51st St
- 12809 W 57th Terrace
- 11907 W 49th Place
- 5021 Bradshaw St
- 5013 Bradshaw St
- 11002 W 55th Terrace
- 5507 Noland Rd
- 14170 W 49th St
- 5807 Noland Rd
- 12023 W 48th St
- 5408 Halsey St
- 5418 Halsey St
- 5402 Halsey St
- 5424 Halsey St
- 5411 Halsey St
- 5415 Halsey St
- 5427 Halsey St
- 5430 Halsey St
- 5401 Halsey St
- 5340 Halsey St
- 5435 Halsey St
- 5339 Halsey St
- 5334 Halsey St
- 12110 W 55th St
- 12114 W 55th St
- 5335 Halsey St
- 5440 Halsey St
- 11948 W 55th St
- 12118 W 55th St
- 11940 W 55th St