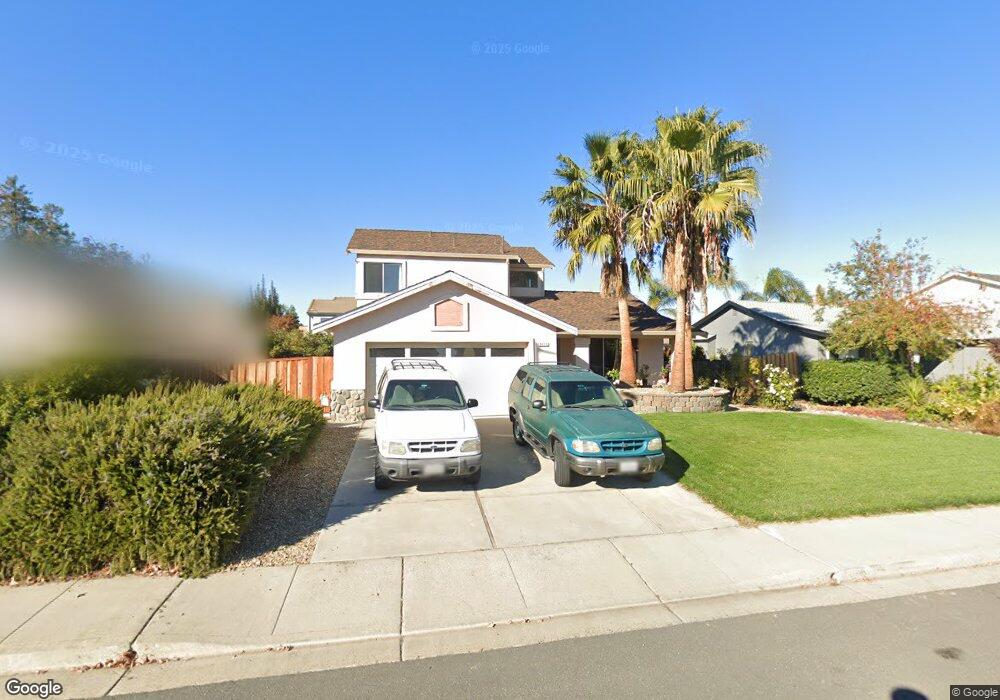
5415 Lakespring Dr Oakley, CA 94561
Estimated Value: $595,000 - $609,837
4
Beds
3
Baths
1,676
Sq Ft
$360/Sq Ft
Est. Value
About This Home
This home is located at 5415 Lakespring Dr, Oakley, CA 94561 and is currently estimated at $603,709, approximately $360 per square foot. 5415 Lakespring Dr is a home located in Contra Costa County with nearby schools including Vintage Parkway Elementary School, Delta Vista Middle School, and Freedom High School.
Ownership History
Date
Name
Owned For
Owner Type
Purchase Details
Closed on
Sep 26, 2012
Sold by
Roberts Dave Paul and Roberts Nancy Mitton
Bought by
Roberts Dave P and Roberts Nancy M
Current Estimated Value
Purchase Details
Closed on
Aug 14, 2012
Sold by
Mitton Stephen A
Bought by
Mitton Nancy Roberts
Purchase Details
Closed on
Jan 28, 2010
Sold by
Mitton Walter H and Mitton Stephen A
Bought by
Mitton Walter H and Mitton Stephen A
Purchase Details
Closed on
Sep 23, 2003
Sold by
Mitton Walter H and Mitton Virginia B
Bought by
Mitton Walter H and Mitton Virginia B
Home Financials for this Owner
Home Financials are based on the most recent Mortgage that was taken out on this home.
Original Mortgage
$104,000
Interest Rate
6.22%
Mortgage Type
Purchase Money Mortgage
Create a Home Valuation Report for This Property
The Home Valuation Report is an in-depth analysis detailing your home's value as well as a comparison with similar homes in the area
Home Values in the Area
Average Home Value in this Area
Purchase History
| Date | Buyer | Sale Price | Title Company |
|---|---|---|---|
| Roberts Dave P | -- | None Available | |
| Roberts Dave Paul | -- | None Available | |
| Mitton Nancy Roberts | -- | None Available | |
| Mitton Walter H | -- | Accommodation | |
| Mitton Walter H | -- | Orange Coast Title | |
| Mitton Walter H | -- | First American Title | |
| Mitton Walter H | -- | First American Title |
Source: Public Records
Mortgage History
| Date | Status | Borrower | Loan Amount |
|---|---|---|---|
| Closed | Mitton Walter H | $104,000 |
Source: Public Records
Tax History
| Year | Tax Paid | Tax Assessment Tax Assessment Total Assessment is a certain percentage of the fair market value that is determined by local assessors to be the total taxable value of land and additions on the property. | Land | Improvement |
|---|---|---|---|---|
| 2025 | $4,135 | $276,843 | $67,967 | $208,876 |
| 2024 | $4,023 | $271,416 | $66,635 | $204,781 |
| 2023 | $4,023 | $266,095 | $65,329 | $200,766 |
| 2022 | $3,994 | $260,879 | $64,049 | $196,830 |
| 2021 | $3,922 | $255,765 | $62,794 | $192,971 |
| 2019 | $3,674 | $248,182 | $60,933 | $187,249 |
| 2018 | $3,587 | $243,317 | $59,739 | $183,578 |
| 2017 | $3,558 | $238,547 | $58,568 | $179,979 |
| 2016 | $3,381 | $233,870 | $57,420 | $176,450 |
| 2015 | $3,401 | $230,358 | $56,558 | $173,800 |
| 2014 | $3,360 | $225,847 | $55,451 | $170,396 |
Source: Public Records
Map
Nearby Homes
- 201 Ohara Ave
- 0 Main St Unit 41115212
- 1 Bradford Island Rd
- 4620 Duarte Ave
- 4920 Dawson Dr
- 1765 Delta Meadows Way
- 5301 Delta Ranch Dr
- 4855 Edgewood Ct
- 1781 Chandon Way
- 1859 Santa fe St
- 5025 Martin St
- 0 Almond Dr Unit 41106452
- 837 Oakwood Way
- 1425 W Cypress Rd
- 912 Rhine Way
- 620 Almond Dr
- 7 Geneseo St
- 13 Geneseo St
- 4863 Bayside Way
- 30 Otsego St
- 5411 Lakespring Dr
- 5419 Lakespring Dr
- 373 Lakespring Place
- 377 Lakespring Place
- 5423 Lakespring Dr
- 5407 Lakespring Dr
- 369 Lakespring Place
- 381 Lakespring Place
- 5414 Lakespring Dr
- 5418 Lakespring Dr
- 220 Northgate Place
- 365 Lakespring Place
- 5403 Lakespring Dr
- 5427 Lakespring Dr
- 385 Lakespring Place
- 5406 Lakespring Dr
- 224 Northgate Place
- 79 Deerpark Ct
- 75 Deerpark Ct
- 5399 Lakespring Dr
Your Personal Tour Guide
Ask me questions while you tour the home.