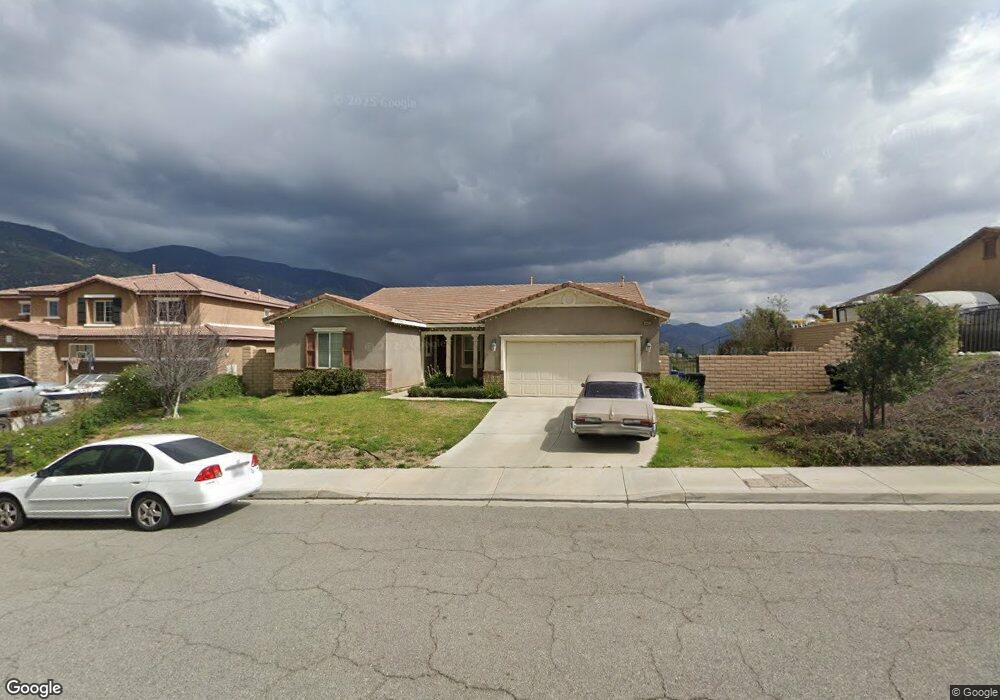
5415 N Valles Dr San Bernardino, CA 92407
Verdemont NeighborhoodEstimated Value: $718,000 - $810,000
4
Beds
3
Baths
2,793
Sq Ft
$270/Sq Ft
Est. Value
About This Home
This home is located at 5415 N Valles Dr, San Bernardino, CA 92407 and is currently estimated at $753,797, approximately $269 per square foot. 5415 N Valles Dr is a home located in San Bernardino County with nearby schools including Bob Holcomb Elementary School, Shandin Hills Middle School, and Cajon High School.
Ownership History
Date
Name
Owned For
Owner Type
Purchase Details
Closed on
Mar 24, 2021
Sold by
Palcomino Moeller Araceli
Bought by
Moeller Bear
Current Estimated Value
Home Financials for this Owner
Home Financials are based on the most recent Mortgage that was taken out on this home.
Original Mortgage
$441,800
Outstanding Balance
$394,929
Interest Rate
2.8%
Mortgage Type
New Conventional
Estimated Equity
$358,868
Purchase Details
Closed on
Jun 7, 2012
Sold by
D R Horton Los Angeles Holding Company I
Bought by
Palomino Moeller Araceli and Moeller Gary
Home Financials for this Owner
Home Financials are based on the most recent Mortgage that was taken out on this home.
Original Mortgage
$378,717
Interest Rate
3.5%
Mortgage Type
FHA
Purchase Details
Closed on
Feb 9, 2011
Sold by
University Park Llc
Bought by
D R Horton Los Angeles Holding Company I
Create a Home Valuation Report for This Property
The Home Valuation Report is an in-depth analysis detailing your home's value as well as a comparison with similar homes in the area
Home Values in the Area
Average Home Value in this Area
Purchase History
| Date | Buyer | Sale Price | Title Company |
|---|---|---|---|
| Moeller Bear | -- | California Best Title | |
| Moeller Bear | -- | Stewart Title Of Ca Inc | |
| Palomino Moeller Araceli | $386,000 | Lawyers Title Company | |
| D R Horton Los Angeles Holding Company I | -- | First American Title Insuran |
Source: Public Records
Mortgage History
| Date | Status | Borrower | Loan Amount |
|---|---|---|---|
| Open | Moeller Bear | $441,800 | |
| Previous Owner | Palomino Moeller Araceli | $378,717 |
Source: Public Records
Tax History Compared to Growth
Tax History
| Year | Tax Paid | Tax Assessment Tax Assessment Total Assessment is a certain percentage of the fair market value that is determined by local assessors to be the total taxable value of land and additions on the property. | Land | Improvement |
|---|---|---|---|---|
| 2025 | $6,691 | $474,966 | $142,489 | $332,477 |
| 2024 | $6,691 | $465,653 | $139,695 | $325,958 |
| 2023 | $6,513 | $456,523 | $136,956 | $319,567 |
| 2022 | $6,496 | $447,572 | $134,271 | $313,301 |
| 2021 | $6,477 | $438,796 | $131,638 | $307,158 |
| 2020 | $6,474 | $434,296 | $130,288 | $304,008 |
| 2019 | $6,285 | $425,780 | $127,733 | $298,047 |
| 2018 | $6,204 | $417,431 | $125,228 | $292,203 |
| 2017 | $6,296 | $409,247 | $122,773 | $286,474 |
| 2016 | $6,100 | $401,223 | $120,366 | $280,857 |
| 2015 | $6,085 | $395,196 | $118,558 | $276,638 |
| 2014 | $5,939 | $387,455 | $116,236 | $271,219 |
Source: Public Records
Map
Nearby Homes
- 1951 Provost Ct
- 5370 N Alumni Ln
- 1805 Clemson St
- 4981 N State St
- 10 Kendall Dr
- 5641 N Pinnacle Ln
- 1559 Wild Pony Path
- 4872 Cambridge Ave
- 5205 N Mammoth Dr
- 1527 Kendall Dr
- 1535 Sheridan Rd
- 1503 Indian Trail
- 5305 Lilac St
- 1435 Breckenridge Ct
- 1548 Teton St
- 5615 Buckboard Dr
- 5294 Sundance Dr
- 1439 Sheridan Rd
- 1511 Yardley St
- 4905 Village Green Way
- 5407 N Valles Dr
- 5423 N Valles Dr
- 5399 N Valles Dr
- 5431 N Valles Dr
- 5403 N Pinnacle Ln
- 5391 N Valles Dr
- 5407 N Pinnacle Ln
- 5439 N Valles Dr
- 5383 N Valles Dr
- 5411 N Pinnacle Ln
- 5447 N Valles Dr
- 5388 N Valles Dr
- 5448 N Valles Dr
- 5415 N Pinnacle Ln
- 5455 N Valles Dr
- 5375 N Valles Dr
- 1831 Northpark Blvd W Unit 1904
- 1831 Northpark Blvd W Unit 2008
- 1831 Northpark Blvd W Unit 501
- 1831 Northpark Blvd W Unit 2206