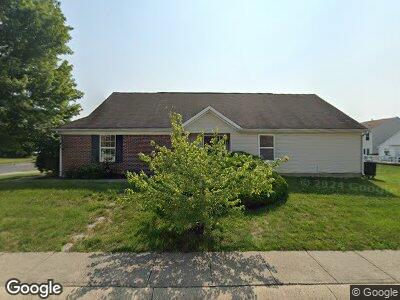
5415 Wilder Way Indianapolis, IN 46216
Estimated Value: $249,000 - $262,000
3
Beds
3
Baths
1,464
Sq Ft
$173/Sq Ft
Est. Value
About This Home
This home is located at 5415 Wilder Way, Indianapolis, IN 46216 and is currently estimated at $253,271, approximately $172 per square foot. 5415 Wilder Way is a home located in Marion County with nearby schools including Harrison Hill Elementary School, Belzer Middle School, and Lawrence Central High School.
Ownership History
Date
Name
Owned For
Owner Type
Purchase Details
Closed on
Sep 10, 2021
Sold by
Jackson Michelle D
Bought by
Harrington Kimberly D and Harrington Patrick
Current Estimated Value
Home Financials for this Owner
Home Financials are based on the most recent Mortgage that was taken out on this home.
Original Mortgage
$186,416
Outstanding Balance
$171,463
Interest Rate
2.8%
Mortgage Type
FHA
Estimated Equity
$78,023
Purchase Details
Closed on
Jul 27, 2005
Sold by
Turner Michelle D
Bought by
Jackson Michelle D
Home Financials for this Owner
Home Financials are based on the most recent Mortgage that was taken out on this home.
Original Mortgage
$150,118
Interest Rate
5.66%
Mortgage Type
FHA
Create a Home Valuation Report for This Property
The Home Valuation Report is an in-depth analysis detailing your home's value as well as a comparison with similar homes in the area
Home Values in the Area
Average Home Value in this Area
Purchase History
| Date | Buyer | Sale Price | Title Company |
|---|---|---|---|
| Harrington Kimberly D | $197,000 | Chicago Title | |
| Jackson Michelle D | -- | None Available |
Source: Public Records
Mortgage History
| Date | Status | Borrower | Loan Amount |
|---|---|---|---|
| Open | Harrington Kimberly D | $49,000 | |
| Open | Harrington Kimberly D | $186,416 | |
| Previous Owner | Jackson Michelle D | $138,270 | |
| Previous Owner | Jackson Michelle D | $147,682 | |
| Previous Owner | Jackson Michelle D | $150,118 |
Source: Public Records
Tax History Compared to Growth
Tax History
| Year | Tax Paid | Tax Assessment Tax Assessment Total Assessment is a certain percentage of the fair market value that is determined by local assessors to be the total taxable value of land and additions on the property. | Land | Improvement |
|---|---|---|---|---|
| 2024 | $2,277 | $205,600 | $32,700 | $172,900 |
| 2023 | $2,277 | $205,600 | $32,700 | $172,900 |
| 2022 | $2,145 | $191,200 | $32,700 | $158,500 |
| 2021 | $1,898 | $167,500 | $32,700 | $134,800 |
| 2020 | $1,837 | $160,300 | $29,600 | $130,700 |
| 2019 | $1,559 | $151,000 | $29,600 | $121,400 |
| 2018 | $1,451 | $140,400 | $29,600 | $110,800 |
| 2017 | $1,384 | $133,900 | $29,600 | $104,300 |
| 2016 | $1,372 | $132,900 | $29,600 | $103,300 |
| 2014 | $1,269 | $126,900 | $29,600 | $97,300 |
| 2013 | $1,407 | $142,800 | $29,600 | $113,200 |
Source: Public Records
Map
Nearby Homes
- 5503 Wilder Way
- 8133 Hazen Way
- 7940 Benjamin Dr
- 7902 Benjamin Dr
- 8144 E 50th St
- 7909 Benjamin Dr
- 7965 Benjamin Dr
- 8357 Harrison Dr
- 5491 Vin Rose Ln
- 7725 E 52nd St
- 7835 E 50th St
- 7642 Lancer Ln
- 7849 E 49th St
- 4751 Payton Ave
- 7367 Parkside Dr
- 4751 N Longworth Ave
- 8936 E 46th St
- 7334 Westchester Dr
- 5736 Birtz Rd
- 5740 Birtz Rd
- 5415 Wilder Way
- 5411 Wilder Way
- 5407 Wilder Way
- 5423 Wilder Way
- 5403 Wilder Way
- 5359 Wilder Way
- 5363 Wilder Way
- 5367 Wilder Way
- 5427 Wilder Way
- 5371 Wilder Way
- 5351 Wilder Way
- 5408 Wilder Way
- 5404 Wilder Way
- 5412 Wilder Way
- 5372 Wilder Way
- 5435 Wilder Way
- 5368 Wilder Way
- 5439 Wilder Way
- 5364 Wilder Way
- 5347 Wilder Way