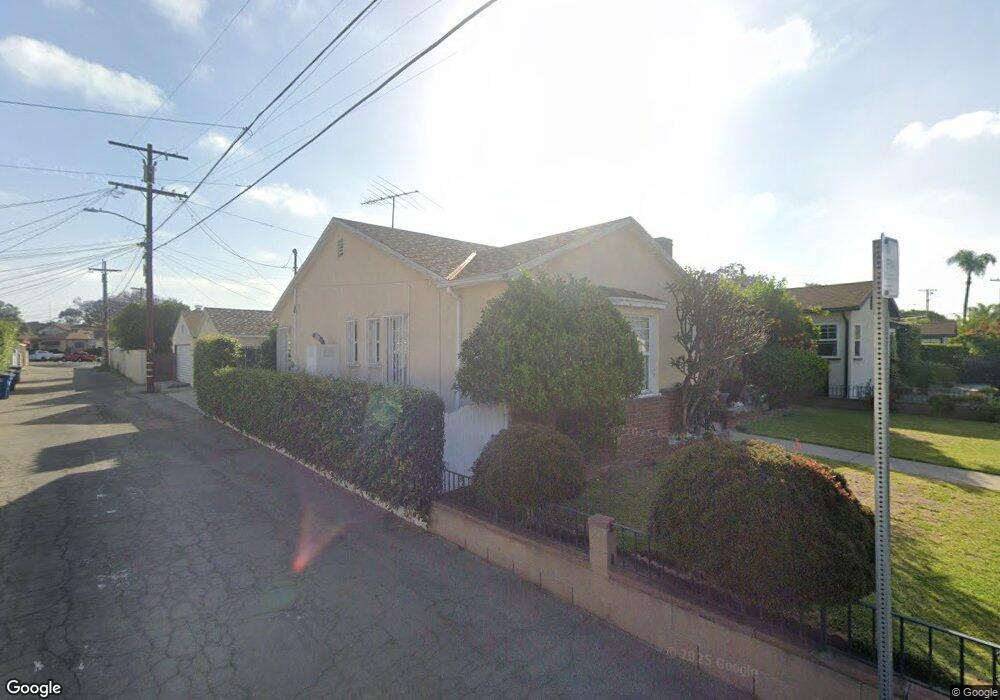
5417 Dewar Ave Los Angeles, CA 90022
Estimated Value: $673,403 - $835,000
2
Beds
1
Bath
1,148
Sq Ft
$653/Sq Ft
Est. Value
About This Home
This home is located at 5417 Dewar Ave, Los Angeles, CA 90022 and is currently estimated at $750,101, approximately $653 per square foot. 5417 Dewar Ave is a home located in Los Angeles County with nearby schools including Robert Hill Lane Elementary School, David Wark Griffith Middle School, and James A. Garfield Senior High School.
Ownership History
Date
Name
Owned For
Owner Type
Purchase Details
Closed on
Jul 14, 1998
Sold by
Avila Teresa
Bought by
Avila Alfredo
Current Estimated Value
Home Financials for this Owner
Home Financials are based on the most recent Mortgage that was taken out on this home.
Original Mortgage
$133,950
Outstanding Balance
$27,436
Interest Rate
7.01%
Mortgage Type
Purchase Money Mortgage
Estimated Equity
$722,665
Purchase Details
Closed on
Jun 24, 1998
Sold by
Arvizu Richard A
Bought by
Avila Alfredo and Avila Dora
Home Financials for this Owner
Home Financials are based on the most recent Mortgage that was taken out on this home.
Original Mortgage
$133,950
Outstanding Balance
$27,436
Interest Rate
7.01%
Mortgage Type
Purchase Money Mortgage
Estimated Equity
$722,665
Purchase Details
Closed on
Jan 13, 1998
Sold by
Arvizu Richard A
Bought by
Arvizu Richard A and Arvizu Juanita M
Create a Home Valuation Report for This Property
The Home Valuation Report is an in-depth analysis detailing your home's value as well as a comparison with similar homes in the area
Home Values in the Area
Average Home Value in this Area
Purchase History
| Date | Buyer | Sale Price | Title Company |
|---|---|---|---|
| Avila Alfredo | -- | Old Republic Title Company | |
| Avila Alfredo | $70,500 | Old Republic Title Company | |
| Avila Alfredo | -- | Old Republic Title Company | |
| Arvizu Richard A | -- | -- |
Source: Public Records
Mortgage History
| Date | Status | Borrower | Loan Amount |
|---|---|---|---|
| Open | Avila Alfredo | $133,950 | |
| Closed | Avila Alfredo | $133,950 |
Source: Public Records
Tax History Compared to Growth
Tax History
| Year | Tax Paid | Tax Assessment Tax Assessment Total Assessment is a certain percentage of the fair market value that is determined by local assessors to be the total taxable value of land and additions on the property. | Land | Improvement |
|---|---|---|---|---|
| 2025 | $3,360 | $221,020 | $141,237 | $79,783 |
| 2024 | $3,360 | $216,687 | $138,468 | $78,219 |
| 2023 | $3,307 | $212,439 | $135,753 | $76,686 |
| 2022 | $3,165 | $208,275 | $133,092 | $75,183 |
| 2021 | $3,126 | $204,192 | $130,483 | $73,709 |
| 2019 | $3,038 | $198,138 | $126,614 | $71,524 |
| 2018 | $2,930 | $194,254 | $124,132 | $70,122 |
| 2016 | $2,803 | $186,713 | $119,313 | $67,400 |
| 2015 | $2,762 | $183,909 | $117,521 | $66,388 |
| 2014 | $2,764 | $180,307 | $115,219 | $65,088 |
Source: Public Records
Map
Nearby Homes
- 264 Margaret Ave
- 812 W Fernfield Dr
- 4421 -4423 Floral Dr
- 249 Simmons Ave
- 3613 Via Campo
- 459 Eastmont Ave
- 545 Eastmont Ave
- 532 W Gleason St
- 1314 W 1st St
- 531 S Hillview Ave
- 573 Belden Ave
- 5505 E 6th St
- 637 Leonard St
- 5643 E 6th St
- 833 Findlay Ave
- 532 Keenan Ave
- 544 Keenan Ave
- 629 Eastmont Ave
- 3413 W Beverly Blvd
- 601 Keenan Ave
- 5423 Dewar Ave
- 275 S Sadler Ave
- 286 Margaret Ave
- 278 Margaret Ave
- 5409 Dewar Ave
- 274 Margaret Ave
- 5412 Dewar Ave
- 268 Margaret Ave
- 302 Margaret Ave
- 5422 Dewar Ave
- 5428 Dewar Ave
- 306 Margaret Ave
- 286 S Sadler Ave
- 276 S Sadler Ave
- 292 S Sadler Ave
- 301 S Sadler Ave
- 272 S Sadler Ave
- 296 S Sadler Ave
- 312 Margaret Ave
- 253 S Sadler Ave