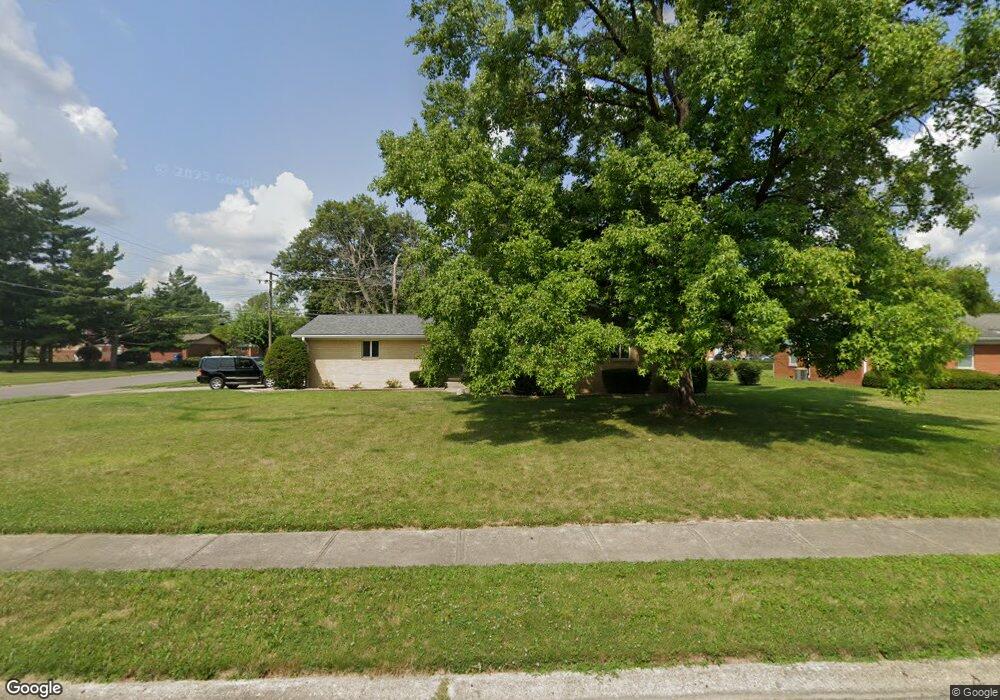
5418 David St Unit Lawrence Indianapolis, IN 46226
Brendonwood NeighborhoodEstimated Value: $280,000 - $319,000
4
Beds
2
Baths
2,893
Sq Ft
$102/Sq Ft
Est. Value
About This Home
This home is located at 5418 David St Unit Lawrence, Indianapolis, IN 46226 and is currently estimated at $295,108, approximately $102 per square foot. 5418 David St Unit Lawrence is a home located in Marion County with nearby schools including Brook Park Elementary School, Belzer Middle School, and Lawrence Central High School.
Ownership History
Date
Name
Owned For
Owner Type
Purchase Details
Closed on
Dec 21, 2018
Bought by
Anthony Bateman
Current Estimated Value
Home Financials for this Owner
Home Financials are based on the most recent Mortgage that was taken out on this home.
Original Mortgage
$171,830
Outstanding Balance
$153,161
Interest Rate
5.5%
Mortgage Type
FHA
Estimated Equity
$141,947
Purchase Details
Closed on
Nov 20, 2018
Sold by
Configo Properties Llc
Bought by
Bateman Anthony and Bateman Nicole
Home Financials for this Owner
Home Financials are based on the most recent Mortgage that was taken out on this home.
Original Mortgage
$171,830
Outstanding Balance
$153,161
Interest Rate
5.5%
Mortgage Type
FHA
Estimated Equity
$141,947
Purchase Details
Closed on
Mar 20, 2018
Sold by
Young David
Bought by
Configo Properties Llc
Purchase Details
Closed on
Jul 21, 2017
Sold by
Stewart Evelyn F
Bought by
Young David
Purchase Details
Closed on
Jul 20, 2017
Sold by
Stewart Evelyn F
Bought by
Young David
Create a Home Valuation Report for This Property
The Home Valuation Report is an in-depth analysis detailing your home's value as well as a comparison with similar homes in the area
Home Values in the Area
Average Home Value in this Area
Purchase History
| Date | Buyer | Sale Price | Title Company |
|---|---|---|---|
| Anthony Bateman | $175,000 | -- | |
| Bateman Anthony | -- | Chicago Title | |
| Configo Properties Llc | -- | -- | |
| Young David | $116,000 | -- | |
| Young David | $139,200 | -- |
Source: Public Records
Mortgage History
| Date | Status | Borrower | Loan Amount |
|---|---|---|---|
| Open | Bateman Anthony | $171,830 |
Source: Public Records
Tax History Compared to Growth
Tax History
| Year | Tax Paid | Tax Assessment Tax Assessment Total Assessment is a certain percentage of the fair market value that is determined by local assessors to be the total taxable value of land and additions on the property. | Land | Improvement |
|---|---|---|---|---|
| 2024 | $4,534 | $202,900 | $24,500 | $178,400 |
| 2023 | $4,534 | $205,100 | $24,500 | $180,600 |
| 2022 | $4,519 | $200,500 | $24,500 | $176,000 |
| 2021 | $4,289 | $189,800 | $24,500 | $165,300 |
| 2020 | $4,209 | $184,400 | $17,200 | $167,200 |
| 2019 | $3,757 | $184,600 | $17,200 | $167,400 |
| 2018 | $2,694 | $131,600 | $17,200 | $114,400 |
| 2017 | $1,364 | $130,400 | $17,200 | $113,200 |
| 2016 | $1,385 | $132,700 | $17,200 | $115,500 |
| 2014 | $1,385 | $138,500 | $17,200 | $121,300 |
| 2013 | $1,385 | $138,500 | $17,200 | $121,300 |
Source: Public Records
Map
Nearby Homes
- 5411 N Kenmore Rd
- 5221 Moonlight Dr
- 4944 N Katherine Dr
- 6921 Clemdale Ave
- 4939 N Kitley Ave
- 5312 N Kercheval Dr
- 5451 Daniel Dr
- 6211 E 55th Place
- 5209 N Kercheval Dr
- 7325 Lowe Dr
- 6230 E 56th St
- 7307 Twin Beech Dr
- 6809 E 47th St
- 7355 Twin Beech Dr
- 5504 Hawthorne Dr
- 4627 Karen Dr
- 6643 E 47th St
- 4628 Dean St
- 7205 E 46th St
- 6016 Dickson Rd