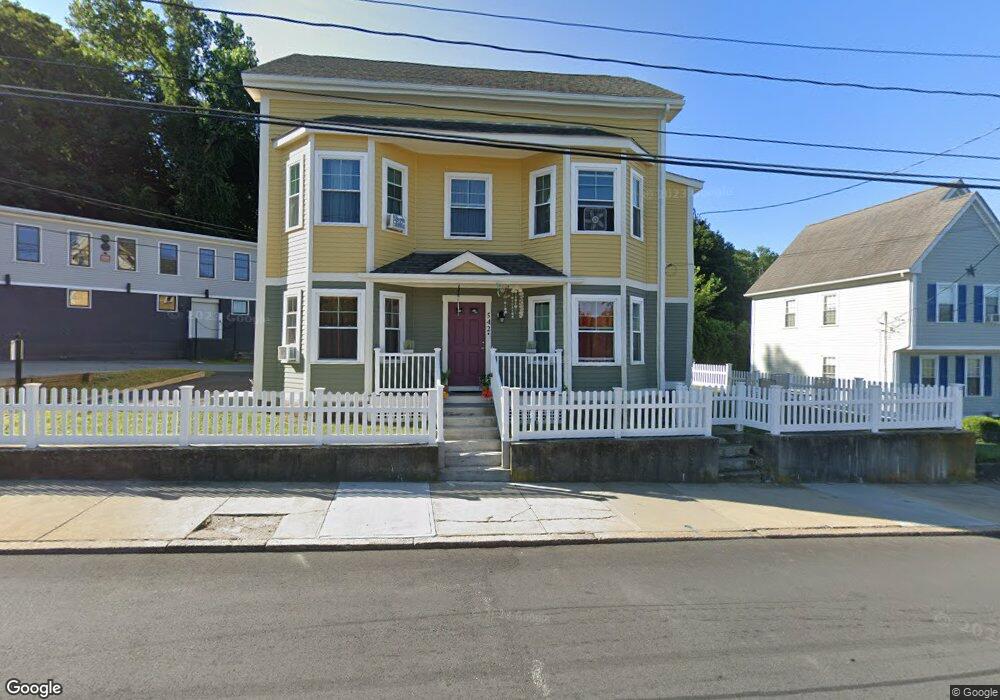
542 Front St Woonsocket, RI 02895
Globe District NeighborhoodEstimated Value: $411,000 - $484,000
6
Beds
3
Baths
2,263
Sq Ft
$202/Sq Ft
Est. Value
About This Home
This home is located at 542 Front St, Woonsocket, RI 02895 and is currently estimated at $457,000, approximately $201 per square foot. 542 Front St is a home located in Providence County with nearby schools including Woonsocket High School, Founders Academy, and Beacon Charter School.
Ownership History
Date
Name
Owned For
Owner Type
Purchase Details
Closed on
Apr 29, 2022
Sold by
Woonsocket Nbrhd Dev Corp
Bought by
Williams Rakema R
Current Estimated Value
Home Financials for this Owner
Home Financials are based on the most recent Mortgage that was taken out on this home.
Original Mortgage
$162,894
Outstanding Balance
$151,807
Interest Rate
4.16%
Mortgage Type
FHA
Estimated Equity
$305,193
Purchase Details
Closed on
Sep 8, 2011
Sold by
Dilazzaro Jody
Bought by
Homesales Inc
Purchase Details
Closed on
Mar 1, 2001
Sold by
Boucher Roger W and Boucher Patricia D
Bought by
Dilazzaro Jody
Create a Home Valuation Report for This Property
The Home Valuation Report is an in-depth analysis detailing your home's value as well as a comparison with similar homes in the area
Home Values in the Area
Average Home Value in this Area
Purchase History
| Date | Buyer | Sale Price | Title Company |
|---|---|---|---|
| Williams Rakema R | $165,900 | None Available | |
| Williams Rakema R | $165,900 | None Available | |
| Williams Rakema R | $165,900 | None Available | |
| Homesales Inc | $63,894 | -- | |
| Homesales Inc | $63,894 | -- | |
| Dilazzaro Jody | $95,000 | -- |
Source: Public Records
Mortgage History
| Date | Status | Borrower | Loan Amount |
|---|---|---|---|
| Open | Williams Rakema R | $162,894 | |
| Closed | Williams Rakema R | $162,894 | |
| Previous Owner | Dilazzaro Jody | $164,913 | |
| Previous Owner | Dilazzaro Jody | $75,000 |
Source: Public Records
Tax History
| Year | Tax Paid | Tax Assessment Tax Assessment Total Assessment is a certain percentage of the fair market value that is determined by local assessors to be the total taxable value of land and additions on the property. | Land | Improvement |
|---|---|---|---|---|
| 2025 | $6,064 | $540,000 | $81,300 | $458,700 |
| 2024 | $4,276 | $294,100 | $82,700 | $211,400 |
| 2023 | $4,694 | $335,800 | $82,700 | $253,100 |
| 2022 | $4,112 | $294,100 | $82,700 | $211,400 |
| 2021 | $3,012 | $126,800 | $33,500 | $93,300 |
| 2020 | $3,043 | $126,800 | $33,500 | $93,300 |
| 2018 | $3,053 | $126,800 | $33,500 | $93,300 |
| 2017 | $3,197 | $106,200 | $36,900 | $69,300 |
| 2016 | $3,381 | $106,200 | $36,900 | $69,300 |
| 2015 | $3,885 | $106,200 | $36,900 | $69,300 |
| 2014 | $3,961 | $110,200 | $40,600 | $69,600 |
Source: Public Records
Map
Nearby Homes
- 379 Front St
- 122 Grand St
- 42 Transit St
- 635 Park Ave
- 15 Knight St
- 120 East St
- 0 Holbrook Ln Unit 1402850
- 99 Allen St Unit 205
- 219 Crawford St
- 233 Grove St
- 180 Allen St Unit 104
- 0 Irving Lot 192 Ave Unit 1383138
- 43 Summit St
- 35 Greene St
- 24 Paradis Ave
- 87 Kermit St
- 59 Cooper Ave
- 190 Coe St
- 435 S Main St
- 115 Railroad St
Your Personal Tour Guide
Ask me questions while you tour the home.