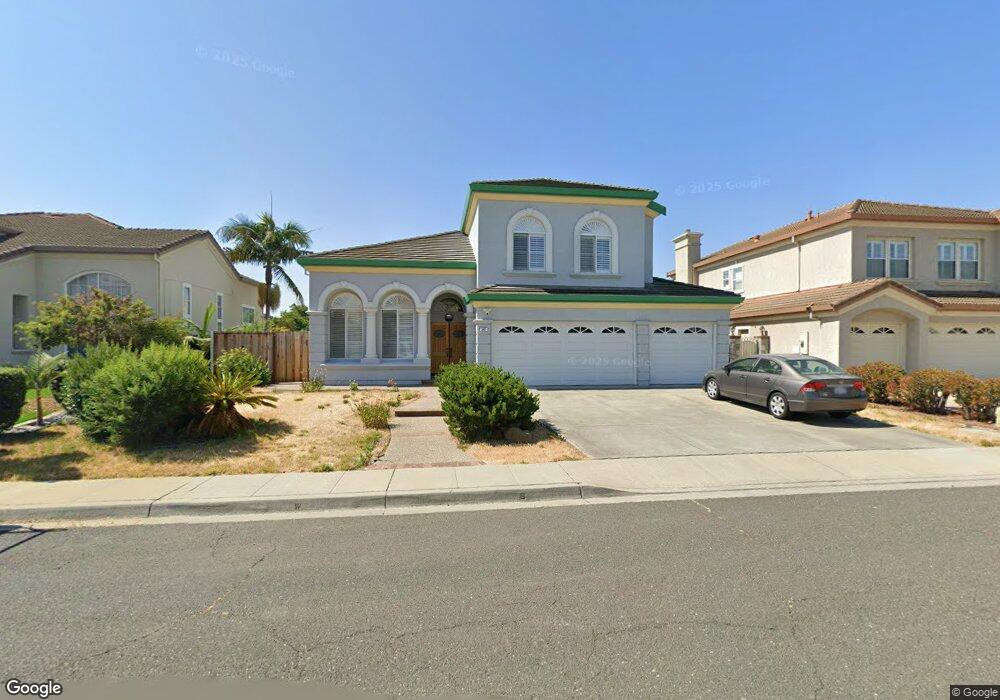
542 Shelley Ct Milpitas, CA 95035
Estimated Value: $2,559,000 - $2,785,000
4
Beds
3
Baths
2,913
Sq Ft
$921/Sq Ft
Est. Value
About This Home
This home is located at 542 Shelley Ct, Milpitas, CA 95035 and is currently estimated at $2,681,674, approximately $920 per square foot. 542 Shelley Ct is a home located in Santa Clara County with nearby schools including Curtner Elementary School, Thomas Russell Middle School, and Milpitas High School.
Ownership History
Date
Name
Owned For
Owner Type
Purchase Details
Closed on
Jan 10, 2018
Sold by
Chen Szusin and Chen Szusin Grace
Bought by
Chen Szusin and The Szusin Chen Revocable Trus
Current Estimated Value
Purchase Details
Closed on
Nov 19, 2001
Sold by
Lu Danny
Bought by
Chen Szusin
Home Financials for this Owner
Home Financials are based on the most recent Mortgage that was taken out on this home.
Original Mortgage
$300,700
Interest Rate
7.11%
Purchase Details
Closed on
May 27, 1997
Sold by
Shapell Industries Inc
Bought by
Lu Danny C and Chen Szusin G
Home Financials for this Owner
Home Financials are based on the most recent Mortgage that was taken out on this home.
Original Mortgage
$396,400
Interest Rate
8.13%
Create a Home Valuation Report for This Property
The Home Valuation Report is an in-depth analysis detailing your home's value as well as a comparison with similar homes in the area
Home Values in the Area
Average Home Value in this Area
Purchase History
| Date | Buyer | Sale Price | Title Company |
|---|---|---|---|
| Chen Szusin | -- | None Available | |
| Chen Szusin | -- | American Title Ins Co | |
| Lu Danny C | $496,000 | First American Title Guarant |
Source: Public Records
Mortgage History
| Date | Status | Borrower | Loan Amount |
|---|---|---|---|
| Previous Owner | Chen Szusin | $300,700 | |
| Previous Owner | Lu Danny C | $396,400 | |
| Closed | Chen Szusin | $80,000 |
Source: Public Records
Tax History Compared to Growth
Tax History
| Year | Tax Paid | Tax Assessment Tax Assessment Total Assessment is a certain percentage of the fair market value that is determined by local assessors to be the total taxable value of land and additions on the property. | Land | Improvement |
|---|---|---|---|---|
| 2025 | $9,428 | $824,563 | $276,865 | $547,698 |
| 2024 | $9,428 | $808,396 | $271,437 | $536,959 |
| 2023 | $9,398 | $792,546 | $266,115 | $526,431 |
| 2022 | $9,359 | $777,007 | $260,898 | $516,109 |
| 2021 | $9,222 | $761,773 | $255,783 | $505,990 |
| 2020 | $9,061 | $753,963 | $253,161 | $500,802 |
| 2019 | $8,957 | $739,181 | $248,198 | $490,983 |
| 2018 | $8,585 | $724,688 | $243,332 | $481,356 |
| 2017 | $8,475 | $710,479 | $238,561 | $471,918 |
| 2016 | $8,133 | $696,549 | $233,884 | $462,665 |
| 2015 | $8,051 | $686,087 | $230,371 | $455,716 |
| 2014 | $7,836 | $672,649 | $225,859 | $446,790 |
Source: Public Records
Map
Nearby Homes
- 800 Los Positos Dr
- 830 Aaron Park Dr
- 1000 Jacklin Rd
- 7280 Marylinn Dr
- 253 Park Hill Dr
- 350 Hearst Dr
- 0 Railroad Ave
- 7 Crystal Ct
- 773 Heflin St
- 99 Jacklin Ct
- 207 Redwood Ave
- 1084 N Hillview Dr
- 521 Topham Ct
- 182 Rose Dr
- 50 Serra Way
- 479 Chestnut Ave
- 1200 N Abbott Ave Unit 200
- 559 Walnut Dr
- 1048 N Abbott Ave
- 468 Glenmoor Cir