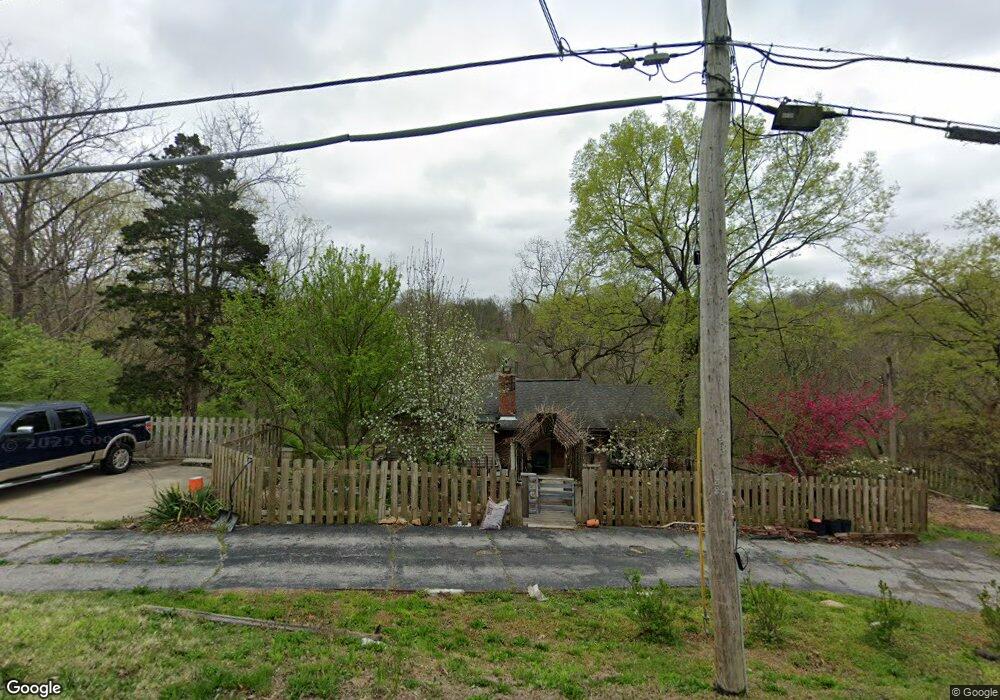
5420 Fern Beach Rd Saint Louis, MO 63128
Estimated Value: $241,000 - $383,000
2
Beds
1
Bath
1,175
Sq Ft
$247/Sq Ft
Est. Value
About This Home
This home is located at 5420 Fern Beach Rd, Saint Louis, MO 63128 and is currently estimated at $290,274, approximately $247 per square foot. 5420 Fern Beach Rd is a home located in St. Louis County with nearby schools including Hagemann Elementary School, Washington Middle School, and Mehlville High School.
Ownership History
Date
Name
Owned For
Owner Type
Purchase Details
Closed on
Dec 28, 2006
Sold by
Michael Todd B and Michael Karrie S
Bought by
Tripp Tamara Maria
Current Estimated Value
Home Financials for this Owner
Home Financials are based on the most recent Mortgage that was taken out on this home.
Original Mortgage
$23,250
Outstanding Balance
$13,809
Interest Rate
6.1%
Mortgage Type
Stand Alone Second
Estimated Equity
$276,465
Purchase Details
Closed on
Aug 11, 2006
Sold by
Michael Todd B and Michael Karrie S
Bought by
Michael Todd B and Michael Kerrie S
Purchase Details
Closed on
Jul 21, 2001
Sold by
Michael Todd B
Bought by
Michael Todd B and Michael Karrie S
Purchase Details
Closed on
Aug 21, 1998
Sold by
Richard Simmons
Bought by
Michael Todd B
Home Financials for this Owner
Home Financials are based on the most recent Mortgage that was taken out on this home.
Original Mortgage
$84,560
Interest Rate
6.9%
Create a Home Valuation Report for This Property
The Home Valuation Report is an in-depth analysis detailing your home's value as well as a comparison with similar homes in the area
Home Values in the Area
Average Home Value in this Area
Purchase History
| Date | Buyer | Sale Price | Title Company |
|---|---|---|---|
| Tripp Tamara Maria | $155,000 | Kts | |
| Michael Todd B | -- | None Available | |
| Michael Todd B | -- | -- | |
| Michael Todd B | -- | -- |
Source: Public Records
Mortgage History
| Date | Status | Borrower | Loan Amount |
|---|---|---|---|
| Open | Tripp Tamara Maria | $23,250 | |
| Open | Tripp Tamara Maria | $124,000 | |
| Previous Owner | Michael Todd B | $84,560 |
Source: Public Records
Tax History Compared to Growth
Tax History
| Year | Tax Paid | Tax Assessment Tax Assessment Total Assessment is a certain percentage of the fair market value that is determined by local assessors to be the total taxable value of land and additions on the property. | Land | Improvement |
|---|---|---|---|---|
| 2025 | $2,606 | $39,850 | $22,330 | $17,520 |
| 2024 | $2,606 | $38,670 | $19,650 | $19,020 |
| 2023 | $2,573 | $38,670 | $19,650 | $19,020 |
| 2022 | $2,433 | $36,740 | $15,350 | $21,390 |
| 2021 | $2,355 | $36,740 | $15,350 | $21,390 |
| 2020 | $2,148 | $31,840 | $15,540 | $16,300 |
| 2019 | $2,142 | $31,840 | $15,540 | $16,300 |
| 2018 | $1,868 | $25,030 | $13,000 | $12,030 |
| 2017 | $1,866 | $25,030 | $13,000 | $12,030 |
| 2016 | $1,872 | $24,100 | $13,000 | $11,100 |
| 2015 | $1,719 | $24,100 | $13,000 | $11,100 |
| 2014 | -- | $21,130 | $5,930 | $15,200 |
Source: Public Records
Map
Nearby Homes
- 10336 Bauer Rd
- 5512 Elk Valley Estates Dr
- 5507 Elk Valley Estates Dr
- 5333 Tesson Ct
- 5374 Tesson Ct
- 5325 Tesson Gardens Ct
- 5334 Tesson Ct
- 13449 Pocasset Dr
- 5100 Tesson Gardens Ct Unit 3C
- 5868 Hightower Dr
- 13372 Bahnfyre Dr
- 5859 Crystal Park Cir
- 4947 Butler Hill Rd
- 10016 Schuessler Rd
- 5263 Faro Dr
- 5401 Green Cedar Way Unit 6
- 13232 East Ln
- 5317 Hamlin Ct
- 13266 East Ln
- 10610 Deerpath Acres Ct
- 5412 Fern Beach Rd
- 5436 Fern Beach Rd
- 5415 Fern Beach Rd
- 5435 Fern Beach Rd
- 5400 Fern Beach Rd
- 5444 Fern Beach Rd
- 5301 Valley View Ln
- 5393 Fern Beach Rd
- 5451 Fern Beach Rd
- 5424 Valley View Ln
- 5370 Valley View Ln
- 5374 Fern Beach Rd
- 5425 Valley View Ln
- 5375 Fern Beach Rd
- 5473 Fern Beach Rd
- 5473 Fern Beach Rd
- 5473 Fern Beach -5475 Rd
- 5442 Valley View Ln
- 5367 Fern Beach Rd
- 13519 Sunset Ridge Ln