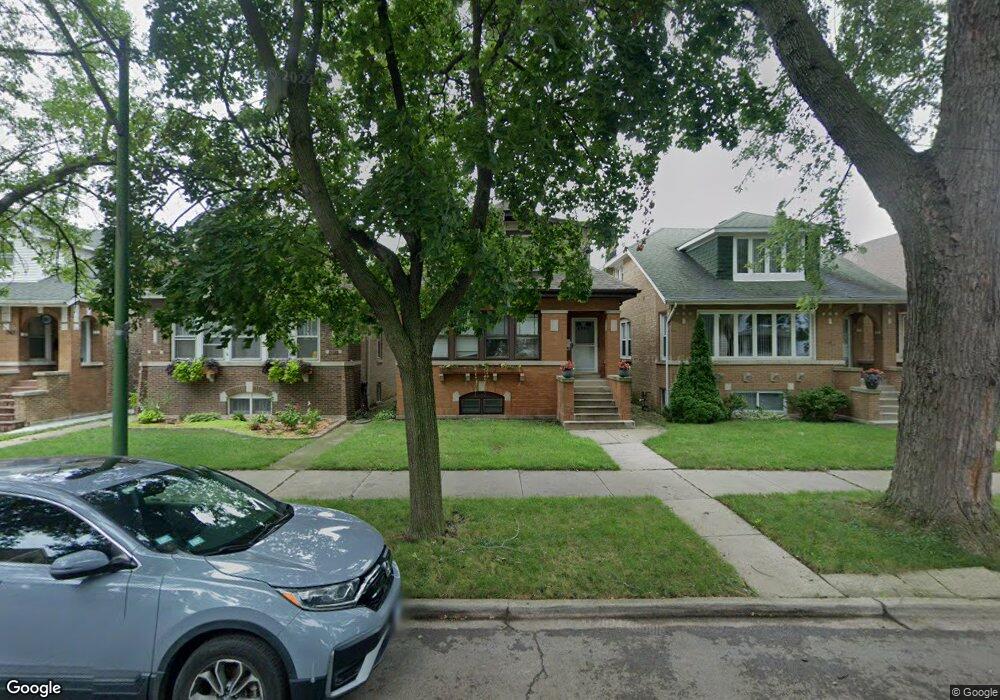
5424 N Lieb Ave Chicago, IL 60630
Jefferson Park NeighborhoodEstimated Value: $393,000 - $473,000
4
Beds
2
Baths
1,085
Sq Ft
$408/Sq Ft
Est. Value
About This Home
This home is located at 5424 N Lieb Ave, Chicago, IL 60630 and is currently estimated at $443,108, approximately $408 per square foot. 5424 N Lieb Ave is a home located in Cook County with nearby schools including Farnsworth Elementary School, Taft High School, and St. Edward School.
Ownership History
Date
Name
Owned For
Owner Type
Purchase Details
Closed on
Aug 7, 2017
Sold by
Fischer Robert J and Fischer Ann M
Bought by
Fischer Robert J and Fischer Ann M
Current Estimated Value
Home Financials for this Owner
Home Financials are based on the most recent Mortgage that was taken out on this home.
Original Mortgage
$287,000
Outstanding Balance
$239,479
Interest Rate
3.96%
Mortgage Type
New Conventional
Estimated Equity
$203,629
Purchase Details
Closed on
Jan 29, 2014
Sold by
Fischer Wayne J and Fischer Janet D
Bought by
Fischer Robert J and Fischer Ann M
Home Financials for this Owner
Home Financials are based on the most recent Mortgage that was taken out on this home.
Original Mortgage
$227,156
Interest Rate
4.25%
Mortgage Type
FHA
Purchase Details
Closed on
Dec 7, 2001
Sold by
Lasalle Bank National Assn
Bought by
Fischer Wayne J and Fischer Janet D
Home Financials for this Owner
Home Financials are based on the most recent Mortgage that was taken out on this home.
Original Mortgage
$160,000
Interest Rate
7.07%
Create a Home Valuation Report for This Property
The Home Valuation Report is an in-depth analysis detailing your home's value as well as a comparison with similar homes in the area
Home Values in the Area
Average Home Value in this Area
Purchase History
| Date | Buyer | Sale Price | Title Company |
|---|---|---|---|
| Fischer Robert J | -- | Fidelity National Title | |
| Fischer Robert J | $235,000 | Chicago Title Insurance Co | |
| Fischer Wayne J | -- | 1St American Title |
Source: Public Records
Mortgage History
| Date | Status | Borrower | Loan Amount |
|---|---|---|---|
| Open | Fischer Robert J | $287,000 | |
| Closed | Fischer Robert J | $227,156 | |
| Previous Owner | Fischer Wayne J | $160,000 |
Source: Public Records
Tax History Compared to Growth
Tax History
| Year | Tax Paid | Tax Assessment Tax Assessment Total Assessment is a certain percentage of the fair market value that is determined by local assessors to be the total taxable value of land and additions on the property. | Land | Improvement |
|---|---|---|---|---|
| 2024 | $5,947 | $34,398 | $9,300 | $25,098 |
| 2023 | $5,776 | $31,484 | $7,440 | $24,044 |
| 2022 | $5,776 | $31,484 | $7,440 | $24,044 |
| 2021 | $5,665 | $31,484 | $7,440 | $24,044 |
| 2020 | $4,346 | $22,601 | $5,022 | $17,579 |
| 2019 | $4,359 | $25,113 | $5,022 | $20,091 |
| 2018 | $4,285 | $25,113 | $5,022 | $20,091 |
| 2017 | $4,072 | $22,280 | $4,464 | $17,816 |
| 2016 | $4,062 | $22,766 | $4,464 | $18,302 |
| 2015 | $4,174 | $22,766 | $4,464 | $18,302 |
| 2014 | $3,723 | $22,621 | $4,092 | $18,529 |
| 2013 | $4,117 | $22,621 | $4,092 | $18,529 |
Source: Public Records
Map
Nearby Homes
- 5218 N Liano Ave
- 5252 N Leamington Ave
- 5233 W Olive Ave
- 5351 W Foster Ave
- 5151 W Winona St
- 5342 W Winnemac Ave
- 5222 W Winnemac Ave
- 5626 N Central Ave
- 5523 N Major Ave
- 9530 N Lamon Ave Unit 403
- 4956 N Lockwood Ave Unit 1
- 5019 W Carmen Ave
- 4946 N Lockwood Ave Unit 1N
- 5700 N Central Ave
- 5657 N Parkside Ave
- 5352 N Magnet Ave
- 4976 N Milwaukee Ave Unit 101
- 4923 W Winona St
- 5111 W Argyle St
- 5134 W Strong St
- 5428 N Lieb Ave
- 5422 N Lieb Ave
- 5430 N Lieb Ave
- 5418 N Lieb Ave
- 5434 N Lieb Ave
- 5416 N Lieb Ave
- 5436 N Lieb Ave
- 5414 N Lieb Ave
- 5425 N Ludlam Ave
- 5423 N Ludlam Ave
- 5429 N Ludlam Ave
- 5440 N Lieb Ave
- 5410 N Lieb Ave
- 5421 N Ludlam Ave
- 5433 N Ludlam Ave
- 5417 N Ludlam Ave
- 5437 N Ludlam Ave
- 5444 N Lieb Ave
- 5406 N Lieb Ave
- 5415 N Ludlam Ave