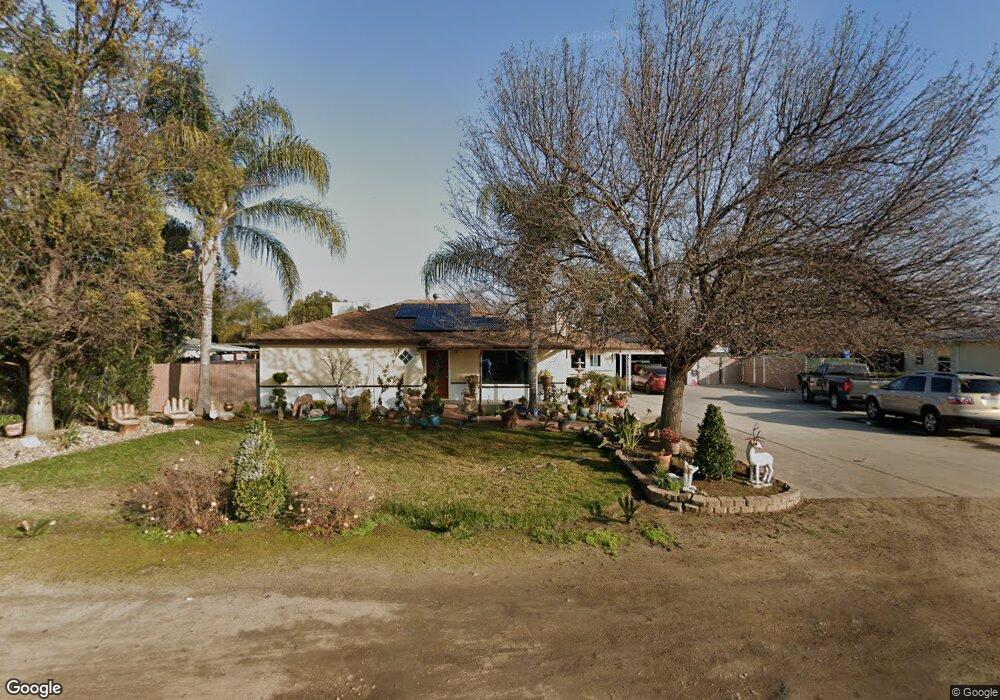
5427 E Mono St Fresno, CA 93727
Sunnyside NeighborhoodEstimated Value: $369,000 - $481,000
4
Beds
1
Bath
1,650
Sq Ft
$252/Sq Ft
Est. Value
About This Home
This home is located at 5427 E Mono St, Fresno, CA 93727 and is currently estimated at $415,468, approximately $251 per square foot. 5427 E Mono St is a home located in Fresno County with nearby schools including Easterby Elementary School, Kings Canyon Middle School, and Sunnyside High School.
Ownership History
Date
Name
Owned For
Owner Type
Purchase Details
Closed on
Jun 20, 2023
Sold by
Sucilla Adan and Sucilla Yolanda
Bought by
Sucilla Adan and Sucilla Yolanda
Current Estimated Value
Purchase Details
Closed on
Apr 1, 2009
Sold by
Wyrick Tom D
Bought by
Sucilla Adan and Garcia Yolanda
Home Financials for this Owner
Home Financials are based on the most recent Mortgage that was taken out on this home.
Original Mortgage
$142,500
Interest Rate
4.76%
Mortgage Type
Purchase Money Mortgage
Purchase Details
Closed on
Jan 13, 2004
Sold by
Wyrick Janis Lynne
Bought by
Wyrick Thomas D
Home Financials for this Owner
Home Financials are based on the most recent Mortgage that was taken out on this home.
Original Mortgage
$222,600
Interest Rate
6.02%
Mortgage Type
New Conventional
Purchase Details
Closed on
Dec 21, 2002
Sold by
Watkins Henry C and Watkins Lori D
Bought by
Wyrick Thomas D
Home Financials for this Owner
Home Financials are based on the most recent Mortgage that was taken out on this home.
Original Mortgage
$193,087
Interest Rate
5.86%
Create a Home Valuation Report for This Property
The Home Valuation Report is an in-depth analysis detailing your home's value as well as a comparison with similar homes in the area
Home Values in the Area
Average Home Value in this Area
Purchase History
| Date | Buyer | Sale Price | Title Company |
|---|---|---|---|
| Sucilla Adan | -- | None Listed On Document | |
| Sucilla Adan | $190,000 | Fidelity National Title Co | |
| Wyrick Thomas D | -- | Fidelity National Title Co | |
| Wyrick Thomas D | $203,500 | Fidelity National Title Co |
Source: Public Records
Mortgage History
| Date | Status | Borrower | Loan Amount |
|---|---|---|---|
| Previous Owner | Sucilla Adan | $142,500 | |
| Previous Owner | Wyrick Thomas D | $222,600 | |
| Previous Owner | Wyrick Thomas D | $193,087 |
Source: Public Records
Tax History
| Year | Tax Paid | Tax Assessment Tax Assessment Total Assessment is a certain percentage of the fair market value that is determined by local assessors to be the total taxable value of land and additions on the property. | Land | Improvement |
|---|---|---|---|---|
| 2025 | $3,114 | $244,659 | $45,065 | $199,594 |
| 2023 | $7,785 | $235,161 | $43,316 | $191,845 |
| 2022 | $7,745 | $230,551 | $42,467 | $188,084 |
| 2021 | $7,665 | $226,032 | $41,635 | $184,397 |
| 2020 | $7,654 | $223,716 | $41,209 | $182,507 |
| 2019 | $7,545 | $219,330 | $40,401 | $178,929 |
| 2018 | $2,639 | $215,030 | $39,609 | $175,421 |
| 2017 | $2,594 | $210,815 | $38,833 | $171,982 |
| 2016 | $2,508 | $206,682 | $38,072 | $168,610 |
| 2015 | $2,470 | $203,579 | $37,501 | $166,078 |
| 2014 | $2,434 | $199,592 | $36,767 | $162,825 |
Source: Public Records
Map
Nearby Homes
- 5526 E Inyo St
- 5458 E Tulare St
- 930 S Park Circle Dr
- 5407 E Tulare St
- 907 S Rogers Ln
- 945 S Clovis Ave Unit V
- 5454 E Butler Ave
- 5478 E Butler Ave
- 5167 E Balch Ave
- 5545 E Washington Ave
- 345 S Bailey Ave
- 350 S Argyle Ave Unit 103
- 350 S Argyle Ave Unit 101
- 5145 E Lane Ave Unit 252
- 540 S Argyle Ave Unit 101
- 372 S Argyle Ave Unit 102
- 5626 E Butler Ave
- 240 S Bailey Ave
- 5576 E Belmont Ave
- 1112 S Sunnyside Ave
- 5435 E Mono St
- 5421 E Mono St
- 5430 E Balch Ave
- 5443 E Mono St
- 5415 E Mono St
- 5422 E Balch Ave
- 5436 E Balch Ave
- 5422 E Mono St
- 5428 E Mono St
- 5416 E Mono St
- 5416 E Mono Ave
- 5414 E Balch Ave
- 5444 E Balch Ave
- 5451 E Mono St
- 545 S Minnewawa Ave
- 5446 E Mono St
- 5410 E Mono Ave
- 5410 E Mono St
- 5406 E Balch Ave
- 5450 E Balch Ave
Your Personal Tour Guide
Ask me questions while you tour the home.