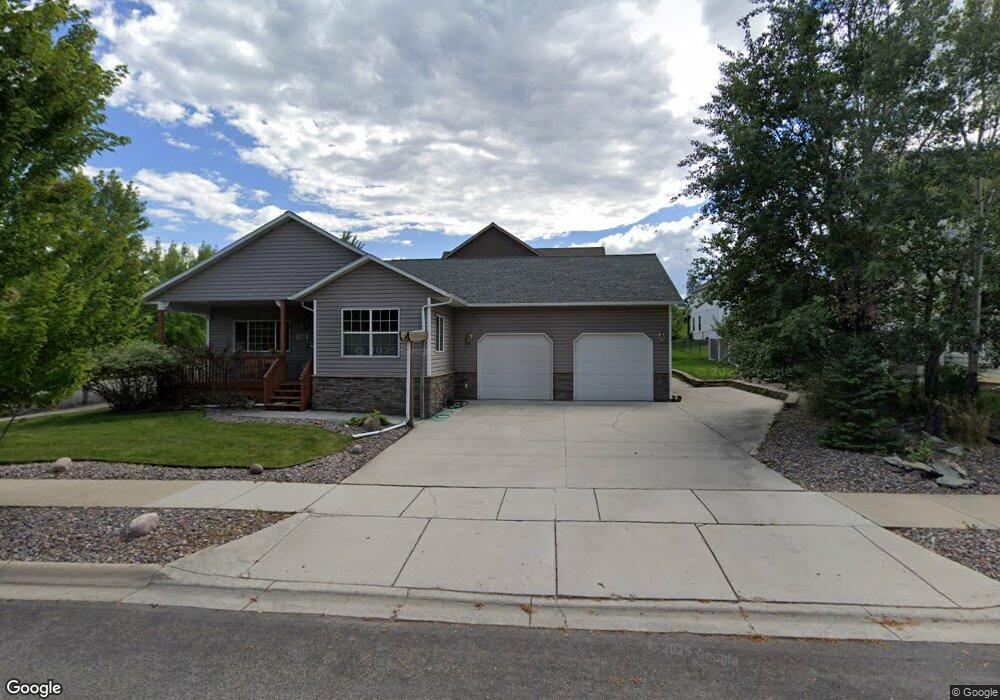
5428 Bigfork Rd Missoula, MT 59803
Miller Creek NeighborhoodEstimated Value: $584,400 - $657,000
3
Beds
2
Baths
1,592
Sq Ft
$397/Sq Ft
Est. Value
About This Home
This home is located at 5428 Bigfork Rd, Missoula, MT 59803 and is currently estimated at $632,800, approximately $397 per square foot. 5428 Bigfork Rd is a home located in Missoula County with nearby schools including Jeannette Rankin Elementary School, Porter Middle School, and Sentinel High School.
Ownership History
Date
Name
Owned For
Owner Type
Purchase Details
Closed on
Dec 15, 2011
Sold by
Crusch Darren D and Crush Charlene S
Bought by
Bernstein Kenneth B and Bernstein Linda F
Current Estimated Value
Home Financials for this Owner
Home Financials are based on the most recent Mortgage that was taken out on this home.
Original Mortgage
$115,000
Interest Rate
3.94%
Mortgage Type
New Conventional
Purchase Details
Closed on
Apr 30, 2007
Sold by
Mountain Construction Inc
Bought by
Crusch Darren D and Crusch Charlene S
Home Financials for this Owner
Home Financials are based on the most recent Mortgage that was taken out on this home.
Original Mortgage
$216,973
Interest Rate
6.11%
Mortgage Type
Purchase Money Mortgage
Create a Home Valuation Report for This Property
The Home Valuation Report is an in-depth analysis detailing your home's value as well as a comparison with similar homes in the area
Home Values in the Area
Average Home Value in this Area
Purchase History
| Date | Buyer | Sale Price | Title Company |
|---|---|---|---|
| Bernstein Kenneth B | -- | First American Title Company | |
| Crusch Darren D | -- | Mt |
Source: Public Records
Mortgage History
| Date | Status | Borrower | Loan Amount |
|---|---|---|---|
| Previous Owner | Bernstein Kenneth B | $115,000 | |
| Previous Owner | Crusch Darren D | $216,973 |
Source: Public Records
Tax History Compared to Growth
Tax History
| Year | Tax Paid | Tax Assessment Tax Assessment Total Assessment is a certain percentage of the fair market value that is determined by local assessors to be the total taxable value of land and additions on the property. | Land | Improvement |
|---|---|---|---|---|
| 2025 | $2,154 | $555,100 | $96,072 | $459,028 |
| 2024 | $2,154 | $438,100 | $82,545 | $355,555 |
| 2023 | $3,399 | $438,100 | $82,545 | $355,555 |
| 2022 | $2,301 | $319,500 | $0 | $0 |
| 2021 | $1,937 | $319,500 | $0 | $0 |
| 2020 | $1,678 | $276,200 | $0 | $0 |
| 2019 | $1,679 | $276,200 | $0 | $0 |
| 2018 | $1,529 | $261,500 | $0 | $0 |
| 2017 | $1,512 | $261,500 | $0 | $0 |
| 2016 | $1,267 | $246,100 | $0 | $0 |
| 2015 | $1,193 | $246,100 | $0 | $0 |
| 2014 | $1,304 | $133,825 | $0 | $0 |
Source: Public Records
Map
Nearby Homes
- 5429 Bigfork Rd
- 5207 Frazer Ct
- 6443 Lower Miller Creek Rd
- 5050 Jordan Ct
- 4434 Harrison Scott Dr
- 5047 Roy Ct
- 5020 Lower Miller Creek Rd
- 4967 Buckhouse Ln
- 4543 Christian Dr
- 12085 U S Highway 93 S
- 4669 Langdon Ct
- 4750 Mark Ct
- 4730 Mark Ct
- 4600 Tiberius Dr
- 4800 Jaiden Ln
- 4884 Lower Miller Creek Rd
- 5959 Hayes Creek Rd
- 4474 Blue Mountain Rd
- 3165 Lamoreux Ln
- 6650 Linda Vista Blvd
- 5436 Bigfork Rd
- 6013 Avon Ln
- 6004 Avon Ln
- 4162 Christian Dr
- 5444 Bigfork Rd
- 5437 Bigfork Rd
- 6010 Avon Ln
- 5421 Bigfork Rd
- 6019 Avon Ln
- 5441 Bigfork Rd
- 6018 Avon Ln
- 4154 Christian Dr
- 5415 Bigfork Rd
- 5452 Bigfork Rd
- 5449 Bigfork Rd
- 6026 Avon Ln
- 6029 Avon Ln
- 5409 Bigfork Rd
- 4146 Christian Dr
- 6001 Hobson Ln