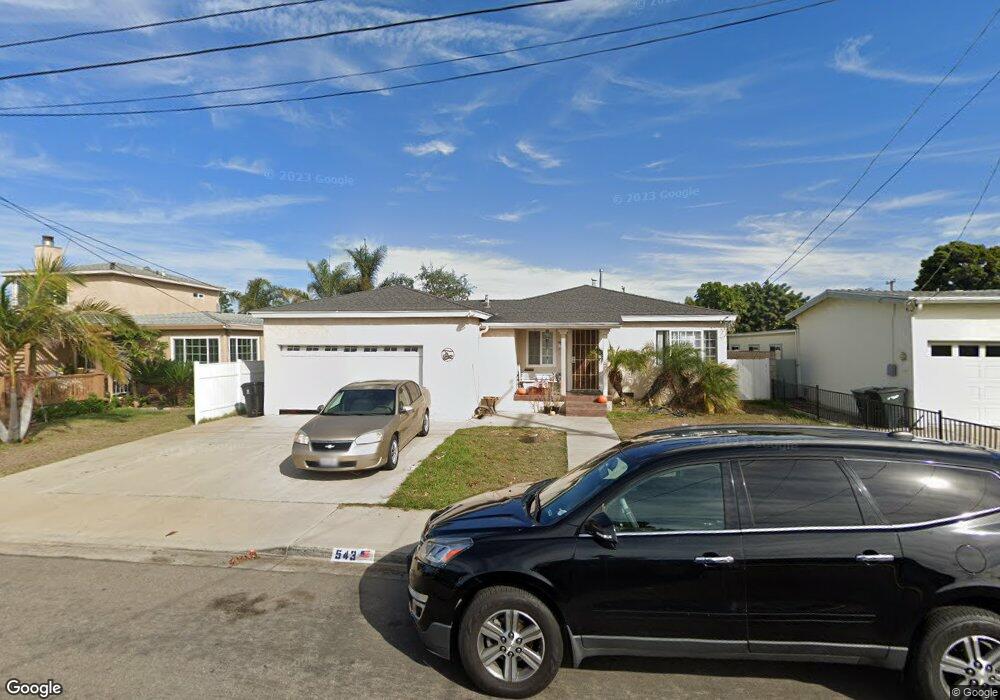
543 Fig Ave Chula Vista, CA 91910
Downtown Chula Vista NeighborhoodEstimated Value: $717,342 - $763,000
3
Beds
2
Baths
1,140
Sq Ft
$648/Sq Ft
Est. Value
About This Home
This home is located at 543 Fig Ave, Chula Vista, CA 91910 and is currently estimated at $738,836, approximately $648 per square foot. 543 Fig Ave is a home located in San Diego County with nearby schools including Vista Square Elementary School, Chula Vista Middle School, and Chula Vista High School.
Ownership History
Date
Name
Owned For
Owner Type
Purchase Details
Closed on
Sep 1, 2021
Sold by
Negrete Richard A and Negrete Monica
Bought by
Negrete Richard A and Negrete Monica
Current Estimated Value
Purchase Details
Closed on
Sep 3, 1997
Sold by
Brodie Edward R and Brodie Palmira A
Bought by
Negrete Monica and Negrete Richard A
Home Financials for this Owner
Home Financials are based on the most recent Mortgage that was taken out on this home.
Original Mortgage
$130,950
Interest Rate
7.54%
Purchase Details
Closed on
Jan 25, 1995
Sold by
Brodie Edward R and Brodie Palmira A
Bought by
Brodie Edward R and Brodie Palmira A
Create a Home Valuation Report for This Property
The Home Valuation Report is an in-depth analysis detailing your home's value as well as a comparison with similar homes in the area
Home Values in the Area
Average Home Value in this Area
Purchase History
| Date | Buyer | Sale Price | Title Company |
|---|---|---|---|
| Negrete Richard A | -- | None Available | |
| Negrete Monica | $135,000 | Gateway Title Company | |
| Brodie Edward R | -- | -- |
Source: Public Records
Mortgage History
| Date | Status | Borrower | Loan Amount |
|---|---|---|---|
| Previous Owner | Negrete Monica | $130,950 |
Source: Public Records
Tax History
| Year | Tax Paid | Tax Assessment Tax Assessment Total Assessment is a certain percentage of the fair market value that is determined by local assessors to be the total taxable value of land and additions on the property. | Land | Improvement |
|---|---|---|---|---|
| 2025 | $2,504 | $215,532 | $78,972 | $136,560 |
| 2024 | $2,504 | $211,307 | $77,424 | $133,883 |
| 2023 | $2,470 | $207,164 | $75,906 | $131,258 |
| 2022 | $2,399 | $203,103 | $74,418 | $128,685 |
| 2021 | $2,344 | $199,121 | $72,959 | $126,162 |
| 2020 | $2,288 | $197,080 | $72,211 | $124,869 |
| 2019 | $2,230 | $193,217 | $70,796 | $122,421 |
| 2018 | $2,195 | $189,429 | $69,408 | $120,021 |
| 2017 | $2,150 | $185,716 | $68,048 | $117,668 |
| 2016 | $2,099 | $182,075 | $66,714 | $115,361 |
| 2015 | $2,069 | $179,341 | $65,712 | $113,629 |
| 2014 | $2,036 | $175,829 | $64,425 | $111,404 |
Source: Public Records
Map
Nearby Homes
- 515 Avenida Centro Unit 101
- 520 Glover Ave
- 490 Fourth Ave Unit 32
- 490 Fourth Ave Unit 21
- 471 4th Ave
- 475 4th Ave Unit H
- 471 4th Ave Unit B
- 689 Garrett Ave
- 709 Brightwood Ave
- 644 Beech Ave
- 617 3rd Ave Unit 14
- 732 Brightwood Ave
- 618-20 Whitney St
- 736 Date Ave
- 536 Park Way Unit 41,42
- 633 Del Mar Ave
- 376 Center St Unit 304
- 376 Center St Unit 220
- 431 Del Mar Ct
- 630 1/2 J St
Your Personal Tour Guide
Ask me questions while you tour the home.