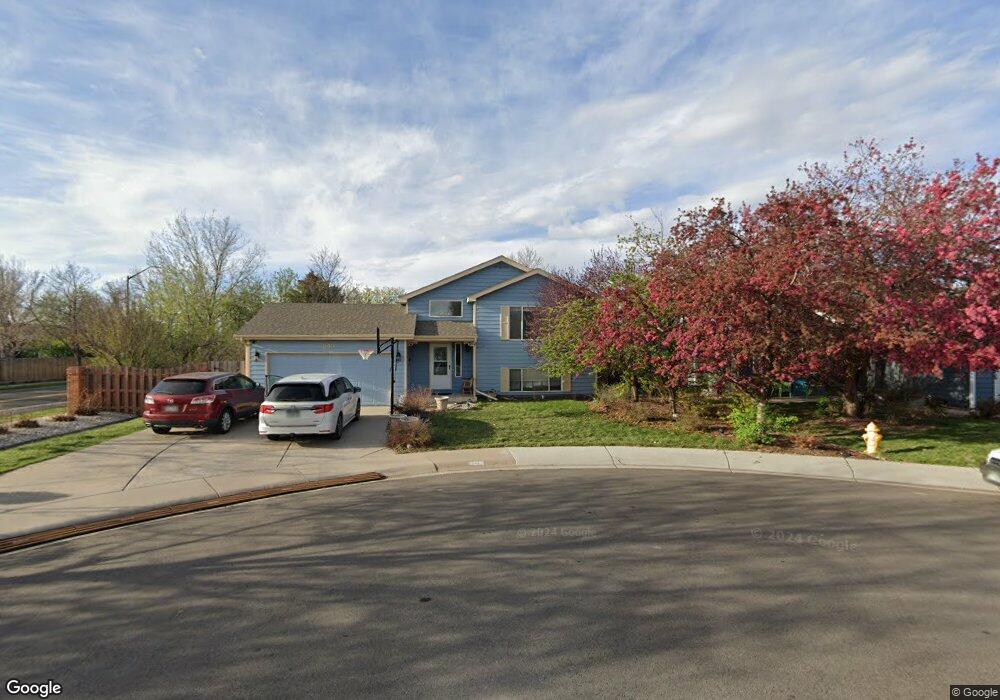
543 Fox Glove Ct Fort Collins, CO 80524
Estimated Value: $534,000 - $573,000
4
Beds
2
Baths
1,962
Sq Ft
$285/Sq Ft
Est. Value
About This Home
This home is located at 543 Fox Glove Ct, Fort Collins, CO 80524 and is currently estimated at $558,721, approximately $284 per square foot. 543 Fox Glove Ct is a home located in Larimer County with nearby schools including Putnam Elementary School, Lincoln Middle School, and Poudre High School.
Ownership History
Date
Name
Owned For
Owner Type
Purchase Details
Closed on
Oct 14, 2011
Sold by
Hersh Imogene
Bought by
Mckinney John R
Current Estimated Value
Home Financials for this Owner
Home Financials are based on the most recent Mortgage that was taken out on this home.
Original Mortgage
$192,691
Outstanding Balance
$132,370
Interest Rate
4.25%
Mortgage Type
FHA
Estimated Equity
$426,351
Purchase Details
Closed on
May 27, 1999
Sold by
Johnson David M
Bought by
Hersh Imogene
Home Financials for this Owner
Home Financials are based on the most recent Mortgage that was taken out on this home.
Original Mortgage
$125,900
Interest Rate
6.91%
Purchase Details
Closed on
Nov 1, 1995
Sold by
Lew Ltd
Bought by
Johnson David M
Purchase Details
Closed on
Apr 1, 1995
Sold by
Sundance Hills F C Ltd
Bought by
Lew Ltd
Purchase Details
Closed on
Oct 21, 1994
Sold by
Burrus David J
Bought by
Sundance Hills Fc Ltd
Purchase Details
Closed on
Aug 1, 1994
Sold by
Sundance Hills F C Ltd
Bought by
Burrus David J
Create a Home Valuation Report for This Property
The Home Valuation Report is an in-depth analysis detailing your home's value as well as a comparison with similar homes in the area
Home Values in the Area
Average Home Value in this Area
Purchase History
| Date | Buyer | Sale Price | Title Company |
|---|---|---|---|
| Mckinney John R | $199,700 | Heritage Title | |
| Hersh Imogene | $139,900 | Security Title | |
| Johnson David M | $123,700 | -- | |
| Lew Ltd | $75,000 | -- | |
| Sundance Hills Fc Ltd | -- | -- | |
| Burrus David J | -- | -- |
Source: Public Records
Mortgage History
| Date | Status | Borrower | Loan Amount |
|---|---|---|---|
| Open | Mckinney John R | $192,691 | |
| Previous Owner | Hersh Imogene | $125,900 |
Source: Public Records
Tax History Compared to Growth
Tax History
| Year | Tax Paid | Tax Assessment Tax Assessment Total Assessment is a certain percentage of the fair market value that is determined by local assessors to be the total taxable value of land and additions on the property. | Land | Improvement |
|---|---|---|---|---|
| 2025 | $3,041 | $35,383 | $2,345 | $33,038 |
| 2024 | $2,894 | $35,383 | $2,345 | $33,038 |
| 2022 | $2,524 | $26,730 | $2,433 | $24,297 |
| 2021 | $2,551 | $27,499 | $2,503 | $24,996 |
| 2020 | $2,311 | $24,697 | $2,503 | $22,194 |
| 2019 | $2,321 | $24,697 | $2,503 | $22,194 |
| 2018 | $2,153 | $23,623 | $2,520 | $21,103 |
| 2017 | $2,146 | $23,623 | $2,520 | $21,103 |
| 2016 | $1,769 | $19,375 | $2,786 | $16,589 |
| 2015 | $1,756 | $19,380 | $2,790 | $16,590 |
| 2014 | $1,450 | $15,900 | $2,790 | $13,110 |
Source: Public Records
Map
Nearby Homes
- 312 Butch Cassidy Dr Unit 4
- 1746 Valley View Ln
- 936 Bramblebush St
- 1013 E Willox Ln
- 624 Lupine Dr
- 1812 Westview Rd
- 0 Lorraine Dr
- 1026 Linden Gate Ct
- 938 Schlagel St Unit 7
- 919 Schlagel St Unit 1
- 919 Schlagel St Unit 3
- 919 Schlagel St Unit 2
- 919 Schlagel St Unit 8
- 919 Schlagel St Unit 5
- 919 Schlagel St Unit 7
- 919 Schlagel St Unit 6
- 820 Schlagel St Unit 5
- 945 Abbott Ln Unit 4
- 921 Abbott Ln Unit 6
- Westfield Plan at Northfield
- 537 Fox Glove Ct
- 1500 Bayberry Cir
- 531 Fox Glove Ct
- 1506 Bayberry Cir
- 1512 Bayberry Cir
- 1509 Thimbleberry Ct
- 1515 Thimbleberry Ct
- 536 Fox Glove Ct
- 525 Fox Glove Ct
- 530 Fox Glove Ct
- 1518 Bayberry Cir
- 1503 Thimbleberry Ct
- 524 Fox Glove Ct
- 1524 Bayberry Cir
- 519 Fox Glove Ct
- 1520 Thimbleberry Ct
- 1418 Wintergreen Way
- 1530 Bayberry Cir
- 518 Fox Glove Ct
- 513 Fox Glove Ct