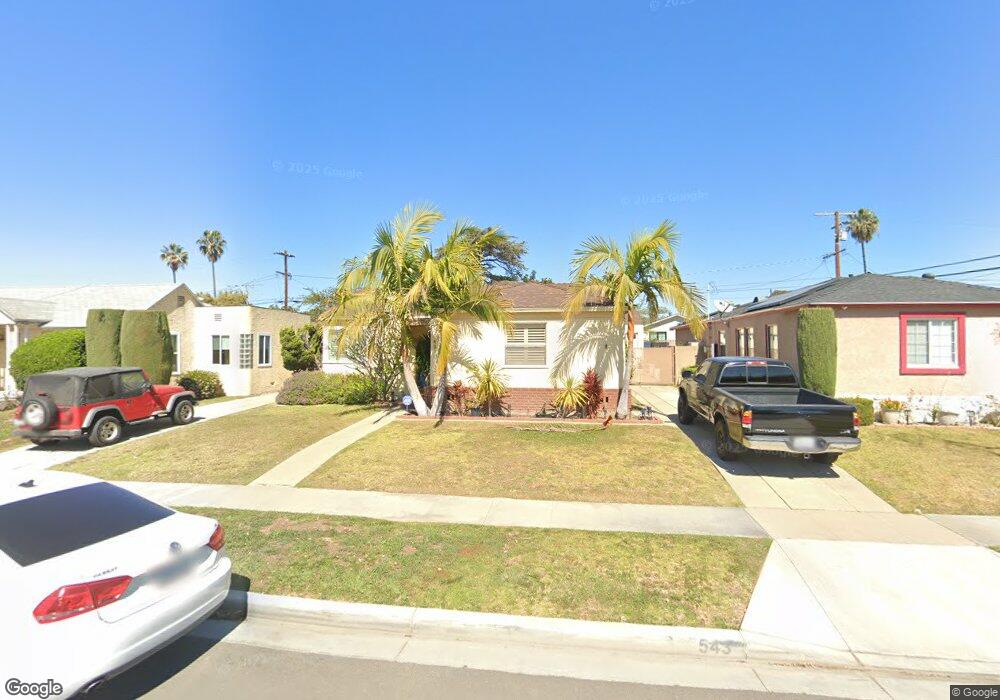
543 W 35th St Long Beach, CA 90806
Wrigley Heights NeighborhoodEstimated Value: $746,141 - $867,000
3
Beds
1
Bath
1,004
Sq Ft
$805/Sq Ft
Est. Value
About This Home
This home is located at 543 W 35th St, Long Beach, CA 90806 and is currently estimated at $808,535, approximately $805 per square foot. 543 W 35th St is a home located in Los Angeles County with nearby schools including Los Cerritos Elementary School, Hughes Middle School, and Long Beach Polytechnic High School.
Ownership History
Date
Name
Owned For
Owner Type
Purchase Details
Closed on
Jan 1, 2018
Sold by
Denison Orlando
Bought by
Denison Orlando and Medico Audrey Lynn
Current Estimated Value
Home Financials for this Owner
Home Financials are based on the most recent Mortgage that was taken out on this home.
Original Mortgage
$85,000
Outstanding Balance
$71,730
Interest Rate
3.94%
Mortgage Type
Credit Line Revolving
Estimated Equity
$736,805
Purchase Details
Closed on
Feb 19, 2010
Sold by
Urban Street Properties Inc
Bought by
Denison Orlando and Denison Franchessa
Home Financials for this Owner
Home Financials are based on the most recent Mortgage that was taken out on this home.
Original Mortgage
$395,300
Interest Rate
4.94%
Mortgage Type
VA
Purchase Details
Closed on
Nov 4, 2009
Sold by
Harlocker Robert L
Bought by
Urban Street Properties Inc
Purchase Details
Closed on
Oct 7, 2009
Sold by
Harlocker Barbara
Bought by
Harlocker Robert L and Harlocker Barbara J
Create a Home Valuation Report for This Property
The Home Valuation Report is an in-depth analysis detailing your home's value as well as a comparison with similar homes in the area
Home Values in the Area
Average Home Value in this Area
Purchase History
| Date | Buyer | Sale Price | Title Company |
|---|---|---|---|
| Denison Orlando | $60,000 | Lawyers Title La | |
| Denison Orlando | $387,000 | Lawyers Title Company | |
| Urban Street Properties Inc | -- | Lawyers Title | |
| Harlocker Robert L | -- | Accommodation |
Source: Public Records
Mortgage History
| Date | Status | Borrower | Loan Amount |
|---|---|---|---|
| Open | Denison Orlando | $85,000 | |
| Previous Owner | Denison Orlando | $395,300 |
Source: Public Records
Tax History
| Year | Tax Paid | Tax Assessment Tax Assessment Total Assessment is a certain percentage of the fair market value that is determined by local assessors to be the total taxable value of land and additions on the property. | Land | Improvement |
|---|---|---|---|---|
| 2025 | $6,615 | $519,428 | $393,484 | $125,944 |
| 2024 | $6,615 | $509,244 | $385,769 | $123,475 |
| 2023 | $6,502 | $499,259 | $378,205 | $121,054 |
| 2022 | $6,104 | $489,471 | $370,790 | $118,681 |
| 2021 | $5,983 | $479,874 | $363,520 | $116,354 |
| 2019 | $5,895 | $465,642 | $352,739 | $112,903 |
| 2018 | $5,486 | $439,032 | $317,647 | $121,385 |
| 2016 | $5,047 | $421,985 | $305,313 | $116,672 |
| 2015 | $4,843 | $415,647 | $300,727 | $114,920 |
| 2014 | $4,809 | $407,506 | $294,837 | $112,669 |
Source: Public Records
Map
Nearby Homes
- 883 W 34th St Unit N
- 874 W 33rd Way
- 3671 Country Club Dr Unit L
- 3237 Daisy Ave
- 3250 Chestnut Ave
- 3159 Daisy Ave
- 3148 Magnolia Ave
- 106 E 36th St
- 3140 Golden Ave
- 3640 Pine Ave
- 3133 Cedar Ave
- 3813 Cedar Ave
- 3729 N Weston Place
- 3381 Elm Ave
- 107 W Spring St Unit C
- 3667 Elm Ave
- 3530 Elm Ave
- 3333 Delta Ave
- 3392 Elm Ave Unit 3
- 2905 Magnolia Ave
Your Personal Tour Guide
Ask me questions while you tour the home.