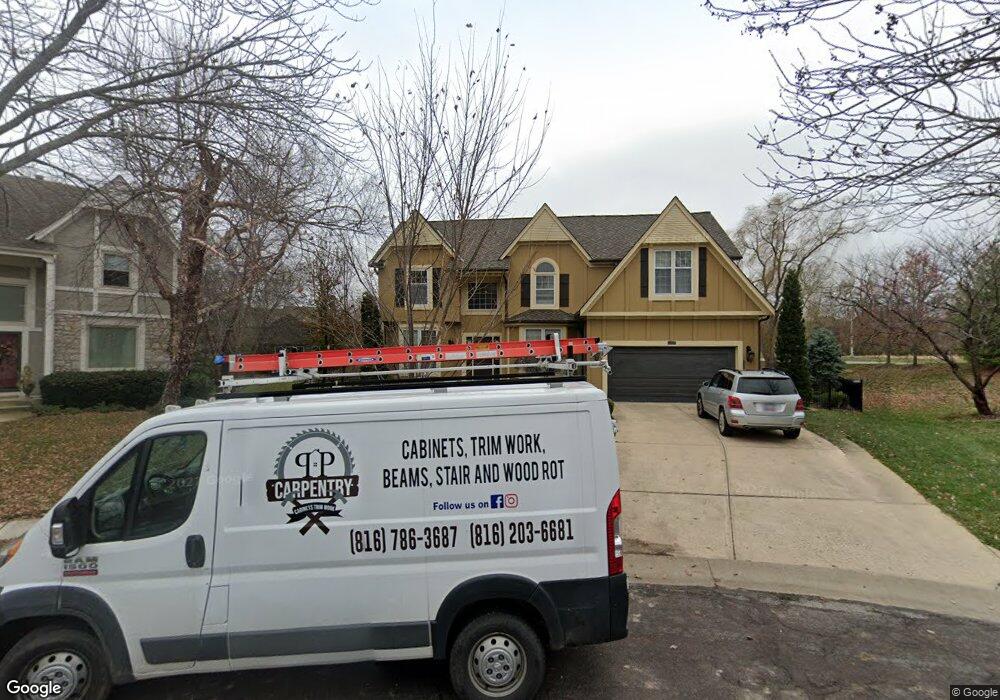
5434 W 139th St Overland Park, KS 66224
Estimated Value: $544,000 - $597,000
4
Beds
3
Baths
2,590
Sq Ft
$221/Sq Ft
Est. Value
About This Home
This home is located at 5434 W 139th St, Overland Park, KS 66224 and is currently estimated at $571,996, approximately $220 per square foot. 5434 W 139th St is a home located in Johnson County with nearby schools including Overland Trail Elementary School, Overland Trail Middle School, and Blue Valley North High School.
Ownership History
Date
Name
Owned For
Owner Type
Purchase Details
Closed on
Jan 10, 2024
Sold by
Pinedo Bruce C
Bought by
Pinedo Daryl M
Current Estimated Value
Purchase Details
Closed on
Jan 3, 2024
Sold by
Pinedo Daryl Manuel
Bought by
Pinedo Daryl and Pinedo Yelena
Purchase Details
Closed on
Feb 22, 2010
Sold by
Federal National Mortgage Association
Bought by
Pinedo Bruce C and Pinedo Daryl M
Home Financials for this Owner
Home Financials are based on the most recent Mortgage that was taken out on this home.
Original Mortgage
$245,373
Interest Rate
4.98%
Mortgage Type
FHA
Purchase Details
Closed on
Aug 19, 2009
Sold by
Crabtree Stevie D and Crabtree Christina K
Bought by
Federal National Mortgage Association
Create a Home Valuation Report for This Property
The Home Valuation Report is an in-depth analysis detailing your home's value as well as a comparison with similar homes in the area
Home Values in the Area
Average Home Value in this Area
Purchase History
| Date | Buyer | Sale Price | Title Company |
|---|---|---|---|
| Pinedo Daryl M | -- | None Listed On Document | |
| Pinedo Daryl M | -- | None Listed On Document | |
| Pinedo Daryl | -- | None Listed On Document | |
| Pinedo Daryl | -- | None Listed On Document | |
| Pinedo Bruce C | -- | Stewart Title Of Kansas City | |
| Federal National Mortgage Association | $195,793 | Continental Title Company |
Source: Public Records
Mortgage History
| Date | Status | Borrower | Loan Amount |
|---|---|---|---|
| Previous Owner | Pinedo Bruce C | $245,373 |
Source: Public Records
Tax History Compared to Growth
Tax History
| Year | Tax Paid | Tax Assessment Tax Assessment Total Assessment is a certain percentage of the fair market value that is determined by local assessors to be the total taxable value of land and additions on the property. | Land | Improvement |
|---|---|---|---|---|
| 2024 | $5,693 | $55,614 | $12,210 | $43,404 |
| 2023 | $5,483 | $52,659 | $12,210 | $40,449 |
| 2022 | $5,254 | $49,554 | $12,210 | $37,344 |
| 2021 | $4,675 | $41,849 | $10,610 | $31,239 |
| 2020 | $4,597 | $40,883 | $8,486 | $32,397 |
| 2019 | $4,497 | $39,146 | $6,062 | $33,084 |
| 2018 | $4,363 | $37,226 | $6,062 | $31,164 |
| 2017 | $4,102 | $34,397 | $6,062 | $28,335 |
| 2016 | $3,621 | $30,349 | $6,062 | $24,287 |
| 2015 | $3,445 | $28,773 | $6,062 | $22,711 |
| 2013 | -- | $28,405 | $6,062 | $22,343 |
Source: Public Records
Map
Nearby Homes
- 14005 Nicklaus Dr
- 5605 Golden Bear Dr
- 14013 Juniper St
- 14008 Outlook St
- 5804 Golden Bear Dr
- 14004 Linden St
- 4411 W 136th Terrace
- 4512 W 139th St
- 13614 Granada Dr
- 13611 Granada Dr
- 5501 W 146th St
- 5701 W 146th St
- 13623 Granada Dr
- 13626 Granada Dr
- 4606 W 136th St
- 13610 Granada Dr
- 13622 Granada Dr
- 13602 Granada Dr
- 13619 Granada Dr
- 14712 Maple St
- 5430 W 139th St
- 5429 W 139th St
- 5430 W 140th St
- 5426 W 139th St
- 5434 W 140th St
- 5425 W 139th St
- 13916 Birch St
- 5426 W 140th St
- 5421 W 139th St
- 5422 W 139th St
- 13912 Birch St
- 13920 Birch St
- 5438 W 140th St
- 13908 Birch St
- 5418 W 139th St
- 5414 W 139th St
- 13904 Birch St
- 5422 W 140th St
- 13924 Birch St
- 5410 W 139th St