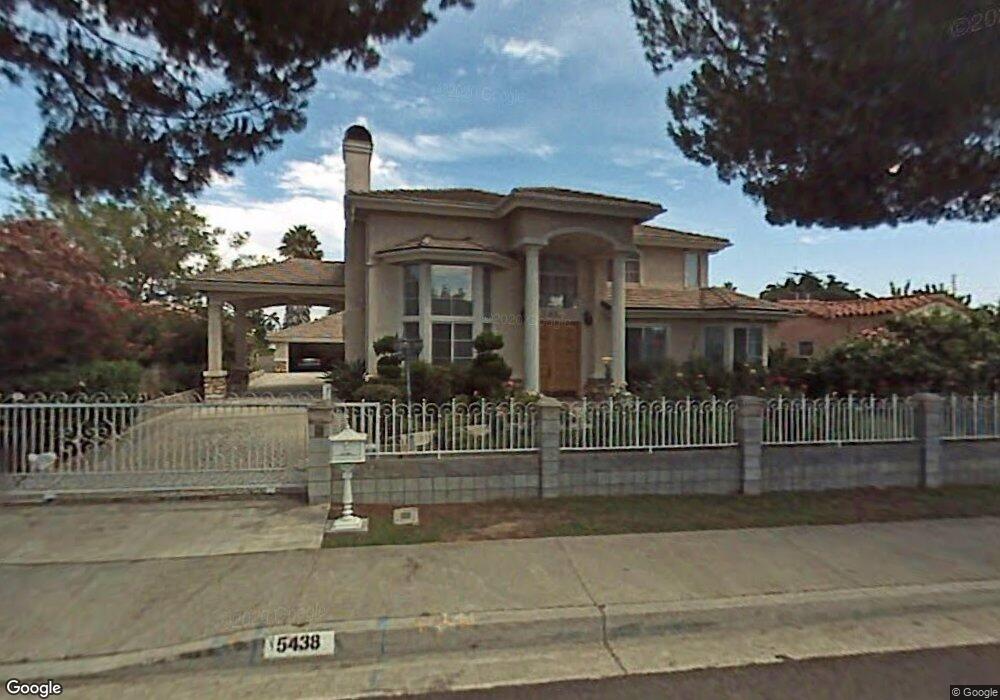
5438 Encinita Ave Temple City, CA 91780
Estimated Value: $1,653,000 - $2,336,000
6
Beds
4
Baths
3,439
Sq Ft
$558/Sq Ft
Est. Value
About This Home
This home is located at 5438 Encinita Ave, Temple City, CA 91780 and is currently estimated at $1,920,097, approximately $558 per square foot. 5438 Encinita Ave is a home located in Los Angeles County with nearby schools including La Rosa Elementary, Oak Avenue Intermediate School, and Temple City High School.
Ownership History
Date
Name
Owned For
Owner Type
Purchase Details
Closed on
Apr 28, 1998
Sold by
Mei Cheng Feng
Bought by
Wang Chia and Mei Cheng Feng
Current Estimated Value
Home Financials for this Owner
Home Financials are based on the most recent Mortgage that was taken out on this home.
Original Mortgage
$295,000
Interest Rate
7.06%
Purchase Details
Closed on
Nov 12, 1997
Sold by
Li James C W
Bought by
Mei Cheng Feng
Purchase Details
Closed on
Feb 14, 1995
Sold by
Chemical Bank
Bought by
Li James C W and Mei Cheng Feng
Home Financials for this Owner
Home Financials are based on the most recent Mortgage that was taken out on this home.
Original Mortgage
$132,000
Interest Rate
9.21%
Purchase Details
Closed on
Jun 27, 1994
Sold by
T D Service Company
Bought by
Chemical Bank
Create a Home Valuation Report for This Property
The Home Valuation Report is an in-depth analysis detailing your home's value as well as a comparison with similar homes in the area
Home Values in the Area
Average Home Value in this Area
Purchase History
| Date | Buyer | Sale Price | Title Company |
|---|---|---|---|
| Wang Chia | -- | Orange Coast Title | |
| Mei Cheng Feng | -- | -- | |
| Li James C W | $176,000 | Old Republic Title Company | |
| Chemical Bank | $71,437 | Fidelity National Title Ins |
Source: Public Records
Mortgage History
| Date | Status | Borrower | Loan Amount |
|---|---|---|---|
| Previous Owner | Wang Chia | $295,000 | |
| Previous Owner | Li James C W | $132,000 |
Source: Public Records
Tax History Compared to Growth
Tax History
| Year | Tax Paid | Tax Assessment Tax Assessment Total Assessment is a certain percentage of the fair market value that is determined by local assessors to be the total taxable value of land and additions on the property. | Land | Improvement |
|---|---|---|---|---|
| 2025 | $8,332 | $684,340 | $295,615 | $388,725 |
| 2024 | $8,332 | $670,922 | $289,819 | $381,103 |
| 2023 | $8,147 | $657,768 | $284,137 | $373,631 |
| 2022 | $7,637 | $644,871 | $278,566 | $366,305 |
| 2021 | $7,757 | $632,227 | $273,104 | $359,123 |
| 2020 | $7,649 | $625,745 | $270,304 | $355,441 |
| 2019 | $7,483 | $613,476 | $265,004 | $348,472 |
| 2018 | $7,214 | $601,448 | $259,808 | $341,640 |
| 2016 | $6,888 | $578,095 | $249,720 | $328,375 |
| 2015 | $6,772 | $569,412 | $245,969 | $323,443 |
| 2014 | $6,677 | $558,259 | $241,151 | $317,108 |
Source: Public Records
Map
Nearby Homes
- 9134 Rancho Real Rd
- 9409 Olive St
- 5530 Alessandro Ave
- 5463 Sultana Ave
- 5327 Buttons Ave
- 9224 Pentland St
- 5635 Noel Dr
- 5619 Sultana Ave Unit A
- 5241 Rosemead Blvd Unit B
- 9406 La Rosa Dr
- 0 Sultana Ave
- 5143 Acacia St
- 4917 Encinita Ave
- 5032 Fiesta Ave
- 5823 Myda Ave
- 9063 Evansport Dr
- 5929 Oak Ave
- 4850 Heleo Ave
- 1281 E Broadway
- 9109 Lower Azusa Rd
- 5432 Encinita Ave
- 5448 Encinita Ave
- 5426 Encinita Ave
- 9229 Hecla Ave
- 9233 Hecla Ave
- 5471 Hilton Ave
- 5420 Encinita Ave
- 9228 Hecla Ave
- 5458 Encinita Ave
- 5467 Hilton Ave
- 5475 Hilton Ave
- 5443 Encinita Ave
- 9235 Hecla Ave
- 5435 Encinita Ave
- 5462 Encinita Ave
- 5449 Encinita Ave
- 9230 Hecla Ave
- 5429 Encinita Ave
- 5414 Encinita Ave
- 5453 Encinita Ave