Estimated Value: $127,303 - $140,000
4
Beds
1
Bath
1,200
Sq Ft
$113/Sq Ft
Est. Value
About This Home
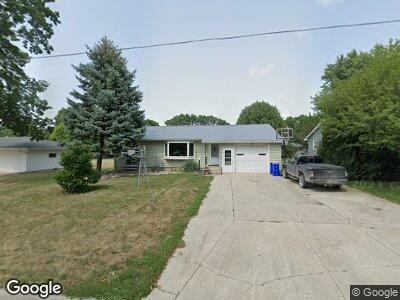
This home is located at 544 5th St SW, Britt, IA 50423 and is currently estimated at $135,076, approximately $112 per square foot. 544 5th St SW is a home located in Hancock County with nearby schools including West Hancock Elementary School, West Hancock Middle School, and West Hancock High School.
Ownership History
Date
Name
Owned For
Owner Type
Purchase Details
Closed on
Apr 27, 2017
Sold by
Swenson Jane
Bought by
Eisenman Steven
Current Estimated Value
Home Financials for this Owner
Home Financials are based on the most recent Mortgage that was taken out on this home.
Original Mortgage
$60,000
Interest Rate
4.14%
Mortgage Type
New Conventional
Purchase Details
Closed on
Aug 10, 2005
Sold by
Freeseman Wilbert J and Freeseman Paula R
Bought by
Seebeck Wm Clarence and Seebeck Genevieve B
Create a Home Valuation Report for This Property
The Home Valuation Report is an in-depth analysis detailing your home's value as well as a comparison with similar homes in the area
Home Values in the Area
Average Home Value in this Area
Purchase History
| Date | Buyer | Sale Price | Title Company |
|---|---|---|---|
| Eisenman Steven | $75,000 | None Available | |
| Seebeck Wm Clarence | $75,000 | None Available |
Source: Public Records
Mortgage History
| Date | Status | Borrower | Loan Amount |
|---|---|---|---|
| Open | Eisenman Steven J | $53,280 | |
| Closed | Eisenman Steven | $60,000 |
Source: Public Records
Tax History Compared to Growth
Tax History
| Year | Tax Paid | Tax Assessment Tax Assessment Total Assessment is a certain percentage of the fair market value that is determined by local assessors to be the total taxable value of land and additions on the property. | Land | Improvement |
|---|---|---|---|---|
| 2024 | $1,830 | $113,300 | $11,550 | $101,750 |
| 2023 | $2,044 | $113,300 | $11,550 | $101,750 |
| 2022 | $1,768 | $109,810 | $11,550 | $98,260 |
| 2021 | $1,764 | $96,180 | $11,550 | $84,630 |
| 2020 | $1,764 | $87,020 | $11,550 | $75,470 |
| 2019 | $1,640 | $87,020 | $11,550 | $75,470 |
| 2018 | $1,636 | $80,160 | $11,550 | $68,610 |
| 2017 | $1,348 | $72,940 | $0 | $0 |
| 2016 | $1,274 | $72,940 | $0 | $0 |
| 2015 | $1,274 | $70,160 | $0 | $0 |
| 2014 | $1,164 | $70,160 | $0 | $0 |
Source: Public Records
Map
Nearby Homes