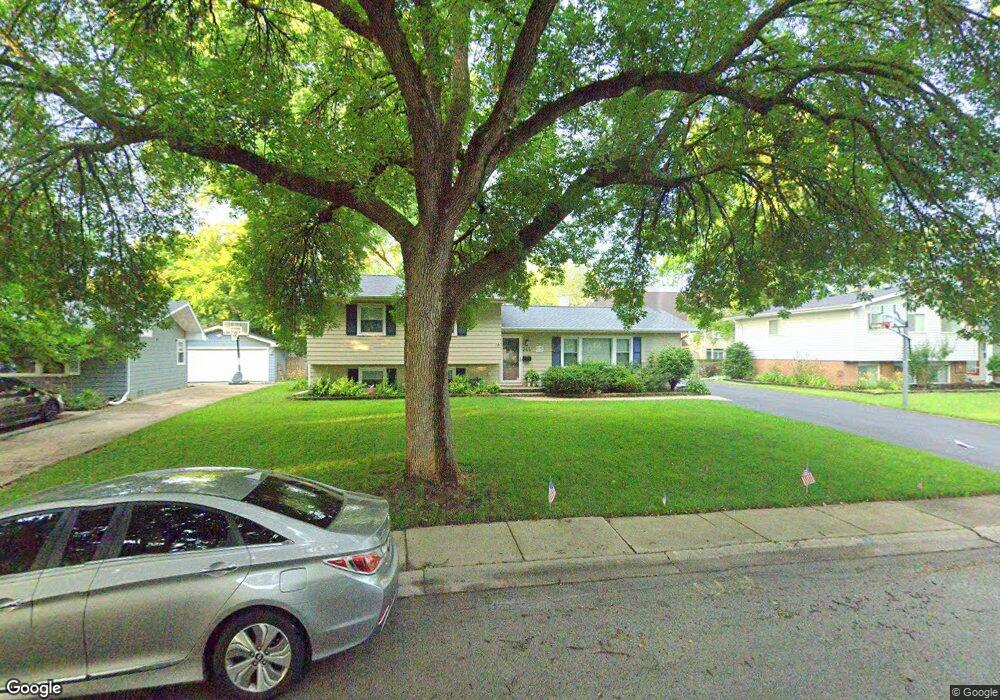
544 Cypress Dr Naperville, IL 60540
West Highlands NeighborhoodEstimated Value: $485,981 - $498,000
3
Beds
2
Baths
1,350
Sq Ft
$366/Sq Ft
Est. Value
About This Home
This home is located at 544 Cypress Dr, Naperville, IL 60540 and is currently estimated at $493,495, approximately $365 per square foot. 544 Cypress Dr is a home located in DuPage County with nearby schools including Elmwood Elementary School, Lincoln Jr. High School, and Naperville Central High School.
Ownership History
Date
Name
Owned For
Owner Type
Purchase Details
Closed on
Oct 16, 1998
Sold by
Kolanowski Stephen J and Kolanowski Jodee
Bought by
Clune Daniel L and Clune Julie A
Current Estimated Value
Home Financials for this Owner
Home Financials are based on the most recent Mortgage that was taken out on this home.
Original Mortgage
$163,100
Outstanding Balance
$35,340
Interest Rate
6.78%
Estimated Equity
$458,155
Purchase Details
Closed on
Nov 17, 1995
Sold by
Reddick Lloyd T and Reddick Lois J
Bought by
Kolanowski Stephen J and Scheele Jodee J
Home Financials for this Owner
Home Financials are based on the most recent Mortgage that was taken out on this home.
Original Mortgage
$138,497
Interest Rate
7.44%
Mortgage Type
FHA
Create a Home Valuation Report for This Property
The Home Valuation Report is an in-depth analysis detailing your home's value as well as a comparison with similar homes in the area
Home Values in the Area
Average Home Value in this Area
Purchase History
| Date | Buyer | Sale Price | Title Company |
|---|---|---|---|
| Clune Daniel L | $181,500 | First American Title | |
| Kolanowski Stephen J | $150,500 | First American Title |
Source: Public Records
Mortgage History
| Date | Status | Borrower | Loan Amount |
|---|---|---|---|
| Open | Clune Daniel L | $163,100 | |
| Previous Owner | Kolanowski Stephen J | $138,497 |
Source: Public Records
Tax History
| Year | Tax Paid | Tax Assessment Tax Assessment Total Assessment is a certain percentage of the fair market value that is determined by local assessors to be the total taxable value of land and additions on the property. | Land | Improvement |
|---|---|---|---|---|
| 2024 | $8,132 | $140,593 | $61,677 | $78,916 |
| 2023 | $7,678 | $126,330 | $55,420 | $70,910 |
| 2022 | $7,281 | $118,690 | $51,730 | $66,960 |
| 2021 | $7,020 | $114,450 | $49,880 | $64,570 |
| 2020 | $6,998 | $114,450 | $49,880 | $64,570 |
| 2019 | $6,742 | $108,850 | $47,440 | $61,410 |
| 2018 | $6,545 | $105,990 | $45,800 | $60,190 |
| 2017 | $6,407 | $102,400 | $44,250 | $58,150 |
| 2016 | $6,247 | $98,280 | $42,470 | $55,810 |
| 2015 | $6,248 | $93,310 | $40,320 | $52,990 |
| 2014 | $6,157 | $89,410 | $38,370 | $51,040 |
| 2013 | $6,116 | $90,030 | $38,640 | $51,390 |
Source: Public Records
Map
Nearby Homes
- 1033 Emerald Dr
- 316 Hemlock Ln
- 534 Grimes Ave
- 845 Tulip Ln
- 316 Sycamore Dr Unit 11
- 840 Mobile Ct
- 313 W Gartner Rd
- 817 Cardiff Rd
- 308 Tamarack Ave
- 1447 Baldwin Ct
- 1161 Banyon Ct
- 289 Winding Creek Dr
- 7S410 Arbor Dr
- 854 Raintree Dr
- 816 S River Rd
- 661 Willow Rd
- 707 Thornwood Dr
- 628 Flock Ave Unit 3
- 706 S Loomis St Unit D
- 731 S River Rd
- 540 Cypress Dr Unit 11
- 552 Cypress Dr
- 553 Juniper Dr
- 549 Juniper Dr
- 536 Cypress Dr
- 560 Cypress Dr
- 545 Cypress Dr
- 553 Cypress Dr
- 545 Juniper Dr
- 561 Juniper Dr
- 541 Cypress Dr
- 557 Cypress Dr
- 532 Cypress Dr
- 537 Cypress Dr
- 561 Cypress Dr
- 564 Cypress Dr
- 541 Juniper Dr
- 565 Juniper Dr Unit 11
- 548 Juniper Dr
- 544 Spruce Dr
Your Personal Tour Guide
Ask me questions while you tour the home.