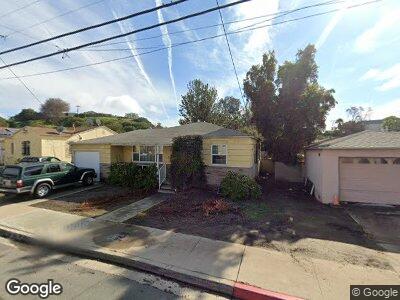
5441 Grape St San Diego, CA 92105
Oak Park NeighborhoodEstimated Value: $612,120 - $723,000
2
Beds
1
Bath
840
Sq Ft
$787/Sq Ft
Est. Value
About This Home
This home is located at 5441 Grape St, San Diego, CA 92105 and is currently estimated at $661,030, approximately $786 per square foot. 5441 Grape St is a home located in San Diego County with nearby schools including Oak Park Elementary School, Mann Middle School, and Crawford High School.
Ownership History
Date
Name
Owned For
Owner Type
Purchase Details
Closed on
Oct 23, 2012
Sold by
Burris Phillip R
Bought by
Burris Phillip R
Current Estimated Value
Purchase Details
Closed on
Jan 11, 2012
Sold by
Burris Phillip R
Bought by
Burris Phillip R
Purchase Details
Closed on
Nov 25, 1997
Sold by
Mayo Johnnie I Aka Burris Johnnie I
Bought by
Burris Floyd R and Burris Johnnie I
Create a Home Valuation Report for This Property
The Home Valuation Report is an in-depth analysis detailing your home's value as well as a comparison with similar homes in the area
Home Values in the Area
Average Home Value in this Area
Purchase History
| Date | Buyer | Sale Price | Title Company |
|---|---|---|---|
| Burris Phillip R | -- | None Available | |
| Burris Phillip R | -- | None Available | |
| Burris Floyd R | -- | -- |
Source: Public Records
Tax History Compared to Growth
Tax History
| Year | Tax Paid | Tax Assessment Tax Assessment Total Assessment is a certain percentage of the fair market value that is determined by local assessors to be the total taxable value of land and additions on the property. | Land | Improvement |
|---|---|---|---|---|
| 2024 | $624 | $54,979 | $23,527 | $31,452 |
| 2023 | $608 | $53,902 | $23,066 | $30,836 |
| 2022 | $591 | $52,846 | $22,614 | $30,232 |
| 2021 | $585 | $51,811 | $22,171 | $29,640 |
| 2020 | $577 | $51,281 | $21,944 | $29,337 |
| 2019 | $566 | $50,276 | $21,514 | $28,762 |
| 2018 | $529 | $49,292 | $21,093 | $28,199 |
| 2017 | $515 | $48,327 | $20,680 | $27,647 |
| 2016 | $504 | $47,380 | $20,275 | $27,105 |
| 2015 | $495 | $46,669 | $19,971 | $26,698 |
| 2014 | $487 | $45,756 | $19,580 | $26,176 |
Source: Public Records
Map
Nearby Homes
- 2151 54th St
- 2012 54th St
- 1667 Pentecost Way Unit 7
- 1621 Pentecost Way Unit 6
- 1631 Pentecost Way Unit 5
- 1651 Pentecost Way Unit 3
- 1649 Pentecost Way Unit 2
- 1611 Pentecost Way Unit 4
- 1623 Pentecost Way Unit 2
- 2003 Bayview Hts Dr Unit 71
- 2003 Bayview Heights Dr Unit 40
- 2003 Bayview Heights Dr Unit 70
- 2003 Bayview Heights Dr Unit 83
- 2003 Bayview Heights Dr Unit 176
- 2003 Bayview Heights Dr Unit 168
- 2003 Bayview Heights Dr Unit 34
- 2003 Bayview Heights Dr Unit 108
- 1862 50th St
- 5061 Marilou Rd Unit 10
- 1635 Mary Lou St
- 5441 Grape St
- 5445 Grape St
- 1987 Champion St
- 1981 Champion St
- 5449 Grape St
- 1977 Champion St
- 5442 Grape St
- 5453 Grape St
- 5446 Grape St
- 1990 Champion St
- 5438 Grape St
- 1971 Champion St
- 5450 Grape St
- 5434 Grape St
- 1982 Champion St
- 5454 Grape St
- 5457 Grape St
- 5430 Grape St
- 5429 Grape St
- 1976 Champion St