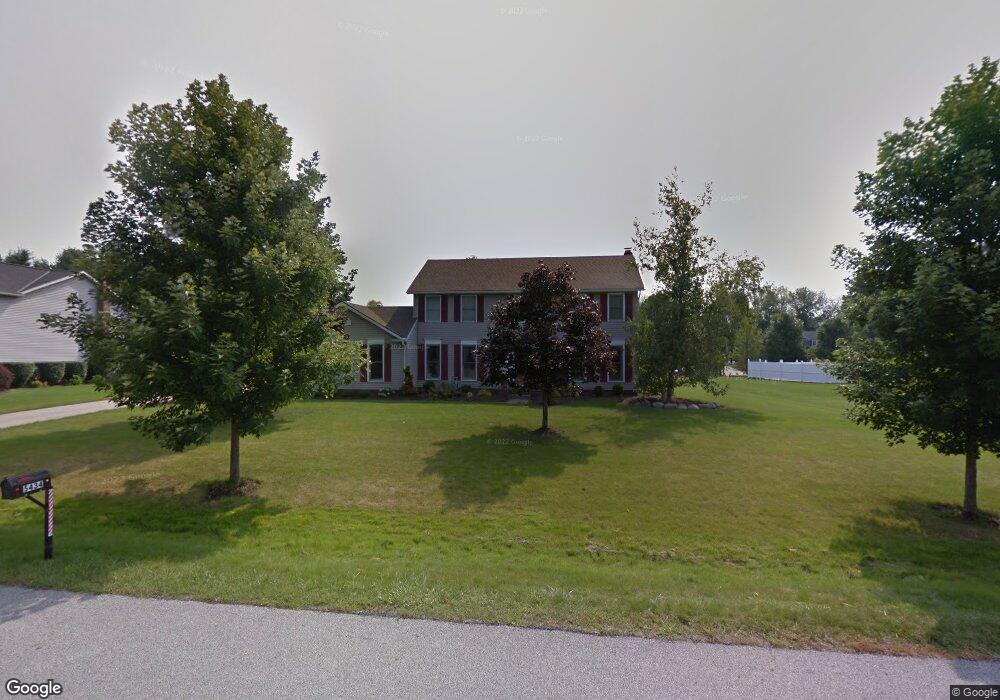
5441 Towbridge Dr Hudson, OH 44236
Estimated Value: $420,000 - $453,000
4
Beds
3
Baths
2,240
Sq Ft
$196/Sq Ft
Est. Value
About This Home
This home is located at 5441 Towbridge Dr, Hudson, OH 44236 and is currently estimated at $439,415, approximately $196 per square foot. 5441 Towbridge Dr is a home located in Summit County with nearby schools including Ellsworth Hill Elementary School, East Woods Intermediate School, and Hudson Middle School.
Ownership History
Date
Name
Owned For
Owner Type
Purchase Details
Closed on
Feb 2, 2022
Sold by
Lightner James L
Bought by
Lightner Catherine Guilian
Current Estimated Value
Home Financials for this Owner
Home Financials are based on the most recent Mortgage that was taken out on this home.
Original Mortgage
$255,000
Outstanding Balance
$236,787
Interest Rate
3.55%
Mortgage Type
New Conventional
Estimated Equity
$202,628
Purchase Details
Closed on
Oct 19, 1998
Sold by
Botzenhart Walter E and Botzenhart Verna K
Bought by
Lightner James L and Lightner Catherine Guillian
Home Financials for this Owner
Home Financials are based on the most recent Mortgage that was taken out on this home.
Original Mortgage
$132,000
Interest Rate
6.72%
Create a Home Valuation Report for This Property
The Home Valuation Report is an in-depth analysis detailing your home's value as well as a comparison with similar homes in the area
Home Values in the Area
Average Home Value in this Area
Purchase History
| Date | Buyer | Sale Price | Title Company |
|---|---|---|---|
| Lightner Catherine Guilian | -- | Mortgage Information Services | |
| Lightner James L | $202,000 | Gateway Title Agency Inc |
Source: Public Records
Mortgage History
| Date | Status | Borrower | Loan Amount |
|---|---|---|---|
| Open | Lightner Catherine Guilian | $255,000 | |
| Previous Owner | Lightner James L | $132,000 |
Source: Public Records
Tax History Compared to Growth
Tax History
| Year | Tax Paid | Tax Assessment Tax Assessment Total Assessment is a certain percentage of the fair market value that is determined by local assessors to be the total taxable value of land and additions on the property. | Land | Improvement |
|---|---|---|---|---|
| 2025 | $6,246 | $116,956 | $21,574 | $95,382 |
| 2024 | $6,246 | $116,956 | $21,574 | $95,382 |
| 2023 | $6,246 | $116,956 | $21,574 | $95,382 |
| 2022 | $5,866 | $98,284 | $18,130 | $80,154 |
| 2021 | $5,649 | $98,284 | $18,130 | $80,154 |
| 2020 | $5,550 | $98,280 | $18,130 | $80,150 |
| 2019 | $5,262 | $86,170 | $18,130 | $68,040 |
| 2018 | $5,243 | $86,170 | $18,130 | $68,040 |
| 2017 | $4,971 | $86,170 | $18,130 | $68,040 |
| 2016 | $5,007 | $79,360 | $18,130 | $61,230 |
| 2015 | $4,971 | $79,360 | $18,130 | $61,230 |
| 2014 | $4,985 | $79,360 | $18,130 | $61,230 |
| 2013 | $4,937 | $76,750 | $18,130 | $58,620 |
Source: Public Records
Map
Nearby Homes
- 0 Lincoln Blvd
- 5491 Sullivan Rd
- 5469 Sullivan Rd
- 5532 Hudson Dr
- 6170 Nicholson Dr
- 166 W Barlow Rd
- 4959 Hudson Dr
- 4844 State Rd
- 4850 State Rd
- HOLLISTER Plan at Reserve at Boulder Estates
- ALDEN Plan at Reserve at Boulder Estates
- PARKETTE Plan at Reserve at Boulder Estates
- BELLEVILLE Plan at Reserve at Boulder Estates
- VANDERBURGH Plan at Reserve at Boulder Estates
- BUCHANAN Plan at Reserve at Boulder Estates
- BEACHWOOD Plan at Reserve at Boulder Estates
- 28 Boulder Blvd
- 52 Boulder Blvd
- 0 Olde Eight Rd Unit 5156367
- V/L Lawnmark Dr
- 5453 Towbridge Dr
- 5427 Towbridge Dr
- 0 Towbridge Dr
- 489 Towbridge Cir
- 5465 Towbridge Dr
- 5434 Towbridge Dr
- 5450 Towbridge Dr
- 5430 Towbridge Dr
- 494 Towbridge Cir
- 5462 Towbridge Dr
- 5418 Towbridge Dr
- 5424 Towbridge Dr
- 5477 Towbridge Dr
- 488 Towbridge Cir
- 5403 Towbridge Dr
- 5474 Towbridge Dr
- 5406 Towbridge Dr
- 5441 Port Chester Dr
- 5453 Port Chester Dr
- 5489 Towbridge Dr