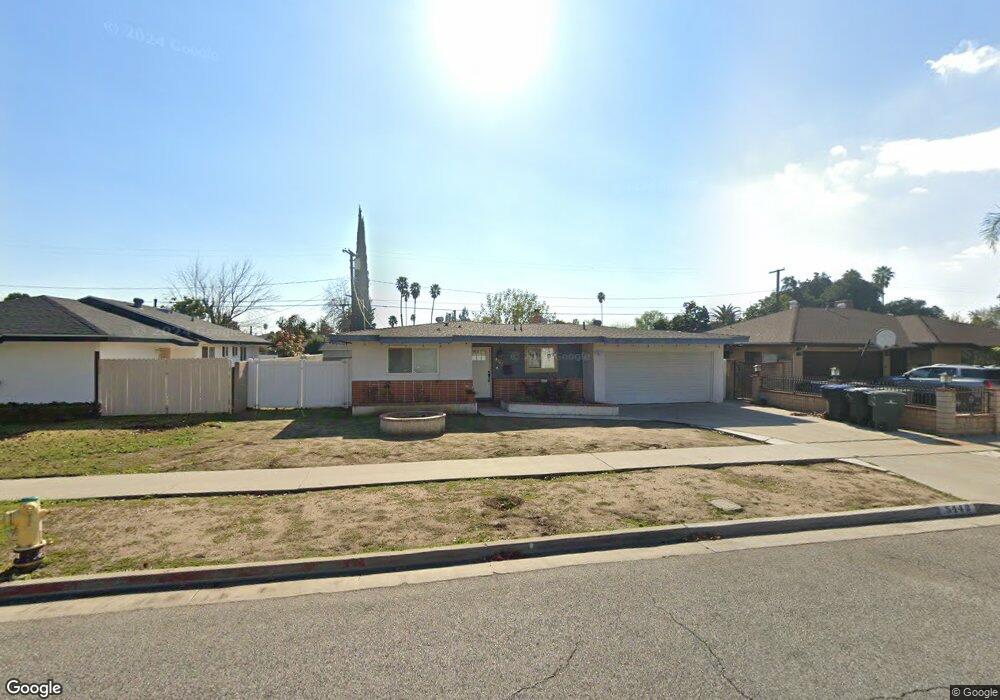
5442 Scott Ave Riverside, CA 92504
Estimated Value: $528,000 - $615,000
3
Beds
2
Baths
1,200
Sq Ft
$475/Sq Ft
Est. Value
About This Home
This home is located at 5442 Scott Ave, Riverside, CA 92504 and is currently estimated at $570,018, approximately $475 per square foot. 5442 Scott Ave is a home located in Riverside County with nearby schools including Jefferson Elementary School, Sierra Middle School, and Ramona High School.
Ownership History
Date
Name
Owned For
Owner Type
Purchase Details
Closed on
Jan 12, 2023
Sold by
Mccauley Kevin C and Mccauley Michelle L
Bought by
Family Trust
Current Estimated Value
Purchase Details
Closed on
Dec 8, 2010
Sold by
Phillips John C and Phillips Maria M
Bought by
Mccauley Kevin C and Mccauley Michelle L
Home Financials for this Owner
Home Financials are based on the most recent Mortgage that was taken out on this home.
Original Mortgage
$128,653
Interest Rate
4.71%
Mortgage Type
FHA
Purchase Details
Closed on
Sep 10, 1998
Sold by
Pacific Trust Fcu
Bought by
Phillips John C and Phillips Maria M
Home Financials for this Owner
Home Financials are based on the most recent Mortgage that was taken out on this home.
Original Mortgage
$84,956
Interest Rate
6.6%
Mortgage Type
FHA
Purchase Details
Closed on
Mar 27, 1998
Sold by
Champ Bobby L and Champ Marie L
Bought by
Pacific Trust Fcu
Create a Home Valuation Report for This Property
The Home Valuation Report is an in-depth analysis detailing your home's value as well as a comparison with similar homes in the area
Purchase History
| Date | Buyer | Sale Price | Title Company |
|---|---|---|---|
| Family Trust | -- | -- | |
| Mccauley Kevin C | $132,000 | Stewart Title | |
| Phillips John C | $85,000 | Lawyers Title Company | |
| Pacific Trust Fcu | $75,000 | American Title Co |
Source: Public Records
Mortgage History
| Date | Status | Borrower | Loan Amount |
|---|---|---|---|
| Previous Owner | Mccauley Kevin C | $128,653 | |
| Previous Owner | Phillips John C | $84,956 |
Source: Public Records
Tax History
| Year | Tax Paid | Tax Assessment Tax Assessment Total Assessment is a certain percentage of the fair market value that is determined by local assessors to be the total taxable value of land and additions on the property. | Land | Improvement |
|---|---|---|---|---|
| 2025 | $1,880 | $169,102 | $57,647 | $111,455 |
| 2023 | $1,880 | $162,537 | $55,409 | $107,128 |
| 2022 | $1,839 | $159,351 | $54,323 | $105,028 |
| 2021 | $1,827 | $156,227 | $53,258 | $102,969 |
| 2020 | $1,813 | $154,626 | $52,712 | $101,914 |
| 2019 | $1,780 | $151,595 | $51,679 | $99,916 |
| 2018 | $1,746 | $148,623 | $50,667 | $97,956 |
| 2017 | $1,716 | $145,710 | $49,674 | $96,036 |
| 2016 | $1,609 | $142,853 | $48,700 | $94,153 |
| 2015 | $1,586 | $140,709 | $47,969 | $92,740 |
| 2014 | $1,571 | $137,954 | $47,030 | $90,924 |
Source: Public Records
Map
Nearby Homes
- 5319 Rochester St
- 6848 Holbrook Way
- 5535 Norman Way
- 6712 La Jolla Dr
- 6458 Rhonda Rd
- 6490 Hillside Ave
- 5121 Sierra St
- 6845 Barcelona Way
- 4364 Via San Luis
- 5171 Merrill Ave
- 5771 Walter St
- 6291 Antioch Ave
- 5111 Arlington Ave
- 0 Arbor Dr
- 6154 Goldenrod Ln
- 5050 Brooklawn Place
- 5033 Brooklawn Place
- 7863 Marbil Ln
- 5865 Green Valley St
- 7869 Sycamore Ave
- 5432 Scott Ave
- 5452 Scott Ave
- 5443 Rochester St
- 5433 Rochester St
- 5422 Scott Ave
- 5462 Scott Ave
- 5453 Rochester St
- 6667 Evelyn Place
- 5423 Rochester St
- 5463 Rochester St
- 6666 Rexford Dr
- 5412 Scott Ave
- 6657 Evelyn Place
- 5413 Rochester St
- 5402 Scott Ave
- 6656 Evelyn Place
- 6645 Evelyn Place
- 5403 Rochester St
- 5483 Rochester St
- 6695 Rexford Dr
Your Personal Tour Guide
Ask me questions while you tour the home.