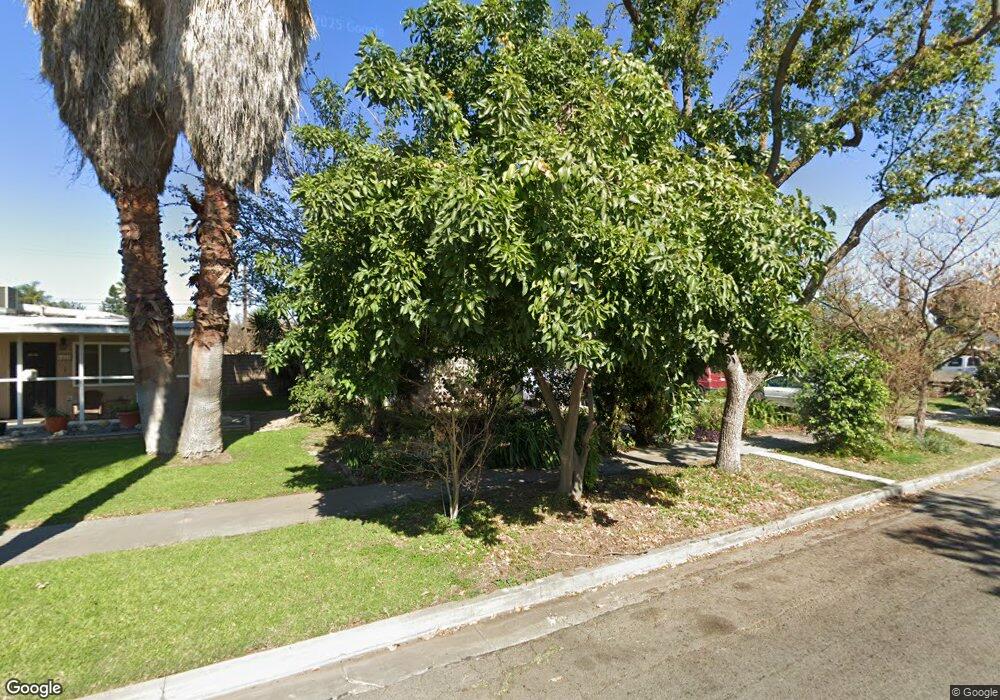
5445 Wayman St Riverside, CA 92504
Estimated Value: $483,233 - $542,000
3
Beds
1
Bath
960
Sq Ft
$528/Sq Ft
Est. Value
About This Home
This home is located at 5445 Wayman St, Riverside, CA 92504 and is currently estimated at $507,308, approximately $528 per square foot. 5445 Wayman St is a home located in Riverside County with nearby schools including Jefferson Elementary School, Sierra Middle School, and Ramona High School.
Ownership History
Date
Name
Owned For
Owner Type
Purchase Details
Closed on
Apr 27, 2001
Sold by
Lemus Miguel T and Lemus Maria M
Bought by
Elias Maria Isabel
Current Estimated Value
Purchase Details
Closed on
Apr 27, 1998
Sold by
Hud
Bought by
Lemus Miguel T and Lemus Maria M
Home Financials for this Owner
Home Financials are based on the most recent Mortgage that was taken out on this home.
Original Mortgage
$70,989
Interest Rate
7.11%
Mortgage Type
FHA
Purchase Details
Closed on
Apr 30, 1997
Sold by
Vongdeuane Soutchay
Bought by
Source One Mtg Services Corp
Purchase Details
Closed on
Feb 5, 1997
Sold by
Source One Mtg Services Corp
Bought by
Hud
Purchase Details
Closed on
Aug 21, 1995
Sold by
Harrison David R and Harrison Patty F
Bought by
Vongdeuane Soutchay
Home Financials for this Owner
Home Financials are based on the most recent Mortgage that was taken out on this home.
Original Mortgage
$84,918
Interest Rate
7.59%
Mortgage Type
FHA
Create a Home Valuation Report for This Property
The Home Valuation Report is an in-depth analysis detailing your home's value as well as a comparison with similar homes in the area
Purchase History
| Date | Buyer | Sale Price | Title Company |
|---|---|---|---|
| Elias Maria Isabel | -- | -- | |
| Lemus Miguel T | $70,000 | Chicago Title Co | |
| Source One Mtg Services Corp | $92,413 | Orange Coast Title | |
| Hud | -- | Orange Coast Title | |
| Vongdeuane Soutchay | $85,000 | Stewart Title Company |
Source: Public Records
Mortgage History
| Date | Status | Borrower | Loan Amount |
|---|---|---|---|
| Previous Owner | Lemus Miguel T | $70,989 | |
| Previous Owner | Vongdeuane Soutchay | $84,918 |
Source: Public Records
Tax History
| Year | Tax Paid | Tax Assessment Tax Assessment Total Assessment is a certain percentage of the fair market value that is determined by local assessors to be the total taxable value of land and additions on the property. | Land | Improvement |
|---|---|---|---|---|
| 2025 | $1,707 | $152,948 | $58,808 | $94,140 |
| 2023 | $1,707 | $147,011 | $56,525 | $90,486 |
| 2022 | $1,669 | $144,129 | $55,417 | $88,712 |
| 2021 | $1,661 | $141,304 | $54,331 | $86,973 |
| 2020 | $1,648 | $139,856 | $53,774 | $86,082 |
| 2019 | $1,618 | $137,115 | $52,720 | $84,395 |
| 2018 | $1,588 | $134,428 | $51,687 | $82,741 |
| 2017 | $1,560 | $131,793 | $50,674 | $81,119 |
| 2016 | $1,464 | $129,210 | $49,681 | $79,529 |
| 2015 | $1,442 | $127,272 | $48,936 | $78,336 |
| 2014 | $1,428 | $124,780 | $47,978 | $76,802 |
Source: Public Records
Map
Nearby Homes
- 6848 Holbrook Way
- 5319 Rochester St
- 6712 La Jolla Dr
- 5535 Norman Way
- 4364 Via San Luis
- 5121 Sierra St
- 6458 Rhonda Rd
- 6845 Barcelona Way
- 6490 Hillside Ave
- 0 Arbor Dr
- 5111 Arlington Ave
- 7863 Marbil Ln
- 5771 Walter St
- 5865 Green Valley St
- 5279 Appleton St
- 7869 Sycamore Ave
- 7796 Sycamore Ave
- 6291 Antioch Ave
- 6267 Sheridan Ct
- 5050 Brooklawn Place
- 5435 Wayman St
- 5465 Wayman St
- 5425 Wayman St
- 5442 Rochester St
- 5452 Rochester St
- 5432 Rochester St
- 5462 Rochester St
- 5475 Wayman St
- 5422 Rochester St
- 5415 Wayman St
- 5446 Wayman St
- 5436 Wayman St
- 5456 Wayman St
- 5424 Wayman St
- 5472 Rochester St
- 5466 Wayman St
- 5412 Rochester St
- 5485 Wayman St
- 5405 Wayman St
- 5414 Wayman St
Your Personal Tour Guide
Ask me questions while you tour the home.