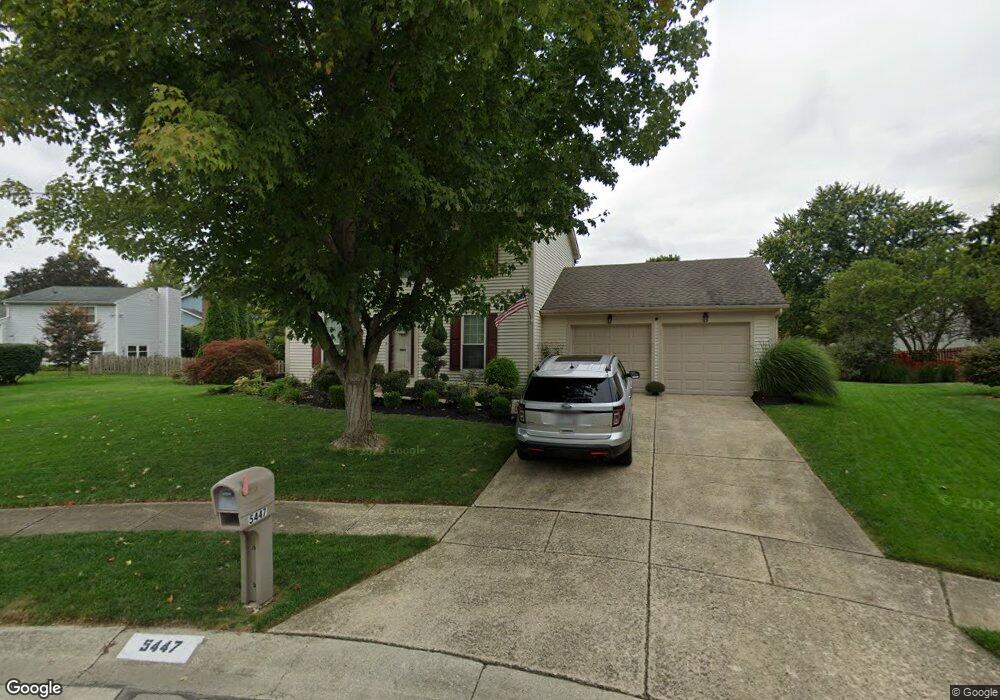
5447 Ramblehurst Ct Columbus, OH 43221
Dexter Falls NeighborhoodEstimated Value: $392,307 - $410,000
3
Beds
3
Baths
1,400
Sq Ft
$287/Sq Ft
Est. Value
About This Home
This home is located at 5447 Ramblehurst Ct, Columbus, OH 43221 and is currently estimated at $402,327, approximately $287 per square foot. 5447 Ramblehurst Ct is a home located in Franklin County with nearby schools including Britton Elementary School, Hilliard Tharp Sixth Grade Elementary School, and Hilliard Weaver Middle School.
Ownership History
Date
Name
Owned For
Owner Type
Purchase Details
Closed on
Jul 26, 2004
Sold by
Heitkamp Scott G and Heitkamp Holly E
Bought by
Kish Kasey
Current Estimated Value
Home Financials for this Owner
Home Financials are based on the most recent Mortgage that was taken out on this home.
Original Mortgage
$134,900
Outstanding Balance
$62,195
Interest Rate
5.37%
Mortgage Type
Purchase Money Mortgage
Estimated Equity
$340,132
Purchase Details
Closed on
Jun 24, 1998
Sold by
Knepler James L and Horak Holli A
Bought by
Heitkamp Scott G and Heitkamp Holly E
Purchase Details
Closed on
Jul 26, 1995
Sold by
Oates Steven L
Bought by
Horak James L Knepler and Horak Holli A
Home Financials for this Owner
Home Financials are based on the most recent Mortgage that was taken out on this home.
Original Mortgage
$97,500
Interest Rate
6.88%
Mortgage Type
New Conventional
Purchase Details
Closed on
Mar 2, 1993
Create a Home Valuation Report for This Property
The Home Valuation Report is an in-depth analysis detailing your home's value as well as a comparison with similar homes in the area
Home Values in the Area
Average Home Value in this Area
Purchase History
| Date | Buyer | Sale Price | Title Company |
|---|---|---|---|
| Kish Kasey | $174,900 | Chicago Tit | |
| Heitkamp Scott G | $135,500 | -- | |
| Horak James L Knepler | $121,900 | -- | |
| -- | $109,000 | -- |
Source: Public Records
Mortgage History
| Date | Status | Borrower | Loan Amount |
|---|---|---|---|
| Open | Kish Kasey | $134,900 | |
| Previous Owner | Horak James L Knepler | $97,500 |
Source: Public Records
Tax History
| Year | Tax Paid | Tax Assessment Tax Assessment Total Assessment is a certain percentage of the fair market value that is determined by local assessors to be the total taxable value of land and additions on the property. | Land | Improvement |
|---|---|---|---|---|
| 2025 | $6,810 | $120,580 | $46,200 | $74,380 |
| 2024 | $6,810 | $120,580 | $46,200 | $74,380 |
| 2023 | $5,900 | $120,575 | $46,200 | $74,375 |
| 2022 | $4,909 | $80,330 | $25,200 | $55,130 |
| 2021 | $4,904 | $80,330 | $25,200 | $55,130 |
| 2020 | $4,890 | $80,330 | $25,200 | $55,130 |
| 2019 | $4,733 | $66,400 | $21,000 | $45,400 |
| 2018 | $4,584 | $66,400 | $21,000 | $45,400 |
| 2017 | $4,714 | $66,400 | $21,000 | $45,400 |
| 2016 | $4,751 | $61,990 | $17,820 | $44,170 |
| 2015 | $4,453 | $61,990 | $17,820 | $44,170 |
| 2014 | $4,461 | $61,990 | $17,820 | $44,170 |
| 2013 | $2,153 | $59,045 | $16,975 | $42,070 |
Source: Public Records
Map
Nearby Homes
- 3848 Stonewater Dr
- 5506 Shannon Heights Blvd
- 3913 Shadowstone Way
- 3884 Antrim Rd
- 3921 Antrim Rd
- 5701 Shannon Heights Blvd
- 3836 Saint Malo Way
- 3873 Tweedsmuir Dr
- 5875 Parkbridge Ln
- 3963 Dinon Dr Unit 3963
- 5049 Dinard Way
- 5884 Parkbridge Ln Unit 193
- 4185 Bradhurst Dr Unit 20
- 5885 Ballymead Blvd
- 3795 Heatherglen Dr
- 3797 Heatherglen Dr
- 5017 Calais Dr Unit 5017
- 4222 Bradhurst Dr Unit 15
- 3863 Heatherglen Dr Unit 3863-3865
- 3865 Heatherglen Dr
- 3879 Man o War Ct
- 5439 Ramblehurst Ct
- 3860 Ramblehurst Rd
- 5455 Ramblehurst Ct
- 3885 Man o War Ct
- 3878 Man o War Ct
- 3866 Ramblehurst Rd
- 5456 Ramblehurst Ct
- 5448 Ramblehurst Ct
- 3872 Ramblehurst Rd
- 3884 Man o War Ct
- 5440 Ramblehurst Ct
- 3893 Man o War Ct
- 3881 Thoroughbred Ct
- 3880 Ramblehurst Rd
- 3839 Ramblehurst Rd
- 3847 Ramblehurst Rd
- 3889 Thoroughbred Ct
- 3892 Man o War Ct
- 3855 Ramblehurst Rd
Your Personal Tour Guide
Ask me questions while you tour the home.