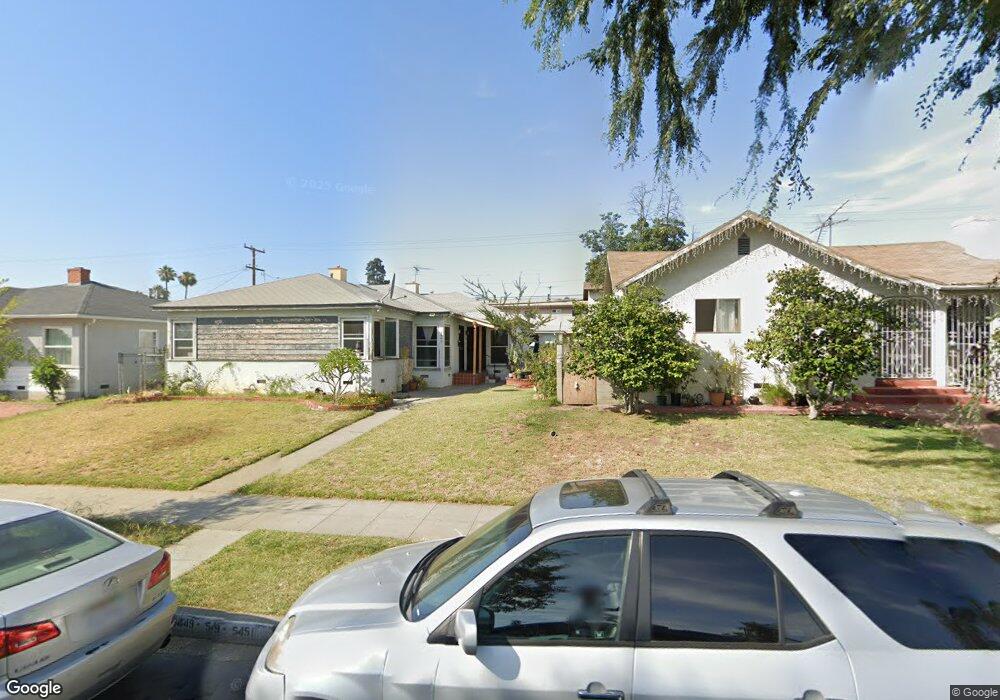
5449 Via Corona St Los Angeles, CA 90022
Estimated Value: $745,435 - $832,000
4
Beds
2
Baths
1,540
Sq Ft
$516/Sq Ft
Est. Value
About This Home
This home is located at 5449 Via Corona St, Los Angeles, CA 90022 and is currently estimated at $794,609, approximately $515 per square foot. 5449 Via Corona St is a home located in Los Angeles County with nearby schools including Fourth Street Elementary School, Fourth Street Primary Center, and David Wark Griffith Middle School.
Ownership History
Date
Name
Owned For
Owner Type
Purchase Details
Closed on
Dec 18, 2003
Sold by
Alvarado Armando
Bought by
Alvarado Armando
Current Estimated Value
Purchase Details
Closed on
Apr 24, 2000
Sold by
Hud
Bought by
Alvarado Armando and Nieva Consejo
Home Financials for this Owner
Home Financials are based on the most recent Mortgage that was taken out on this home.
Original Mortgage
$173,569
Interest Rate
8.37%
Mortgage Type
FHA
Purchase Details
Closed on
Feb 22, 2000
Sold by
Old Kent Mtg Company
Bought by
Hud
Purchase Details
Closed on
May 13, 1999
Sold by
Velazquez Rigoberto
Bought by
Old Kent Mtg Company
Purchase Details
Closed on
Nov 25, 1996
Sold by
Morales David L
Bought by
Velazquez Rigoberto and Ruiz Juana
Home Financials for this Owner
Home Financials are based on the most recent Mortgage that was taken out on this home.
Original Mortgage
$189,213
Interest Rate
7.53%
Mortgage Type
FHA
Create a Home Valuation Report for This Property
The Home Valuation Report is an in-depth analysis detailing your home's value as well as a comparison with similar homes in the area
Home Values in the Area
Average Home Value in this Area
Purchase History
| Date | Buyer | Sale Price | Title Company |
|---|---|---|---|
| Alvarado Armando | -- | First American Title Ins Co | |
| Alvarado Armando | $175,000 | Chicago Title Co | |
| Hud | -- | American Title | |
| Old Kent Mtg Company | $204,141 | Benefit Land Title Ins Co | |
| Velazquez Rigoberto | $195,000 | Gateway Title Company |
Source: Public Records
Mortgage History
| Date | Status | Borrower | Loan Amount |
|---|---|---|---|
| Previous Owner | Alvarado Armando | $173,569 | |
| Previous Owner | Velazquez Rigoberto | $189,213 |
Source: Public Records
Tax History Compared to Growth
Tax History
| Year | Tax Paid | Tax Assessment Tax Assessment Total Assessment is a certain percentage of the fair market value that is determined by local assessors to be the total taxable value of land and additions on the property. | Land | Improvement |
|---|---|---|---|---|
| 2025 | $5,188 | $340,827 | $193,546 | $147,281 |
| 2024 | $5,188 | $334,145 | $189,751 | $144,394 |
| 2023 | $4,936 | $327,594 | $186,031 | $141,563 |
| 2022 | $4,726 | $321,172 | $182,384 | $138,788 |
| 2021 | $4,668 | $314,875 | $178,808 | $136,067 |
| 2019 | $4,536 | $305,537 | $173,505 | $132,032 |
| 2018 | $4,416 | $299,547 | $170,103 | $129,444 |
| 2016 | $4,231 | $287,917 | $163,499 | $124,418 |
| 2015 | $4,169 | $283,594 | $161,044 | $122,550 |
| 2014 | $4,172 | $278,040 | $157,890 | $120,150 |
Source: Public Records
Map
Nearby Homes
- 459 Eastmont Ave
- 4421 -4423 Floral Dr
- 264 Margaret Ave
- 545 Eastmont Ave
- 249 Simmons Ave
- 5505 E 6th St
- 573 Belden Ave
- 5643 E 6th St
- 531 S Hillview Ave
- 812 W Fernfield Dr
- 3613 Via Campo
- 629 Eastmont Ave
- 532 Keenan Ave
- 544 Keenan Ave
- 637 Leonard St
- 601 Keenan Ave
- 3413 W Beverly Blvd
- 668 Keenan Ave
- 731 Belden Ave
- 631 Leonard Ave
- 5455 Via Corona St
- 5443 Via Corona St
- 5459 Via Corona St
- 5439 Via Corona St
- 5452 E Beverly Blvd
- 5442 E Beverly Blvd
- 5435 Via Corona St
- 5501 Via Corona St
- 5460 E Beverly Blvd
- 5448 Via Corona St
- 5444 Via Corona St
- 5454 Via Corona St Unit back unit
- 5454 Via Corona St
- 5507 Via Corona St
- 5429 Via Corona St
- 5440 Via Corona St
- 5458 Via Corona St
- 5470 E Beverly Blvd
- 5430 E Beverly Blvd
- 5434 Via Corona St