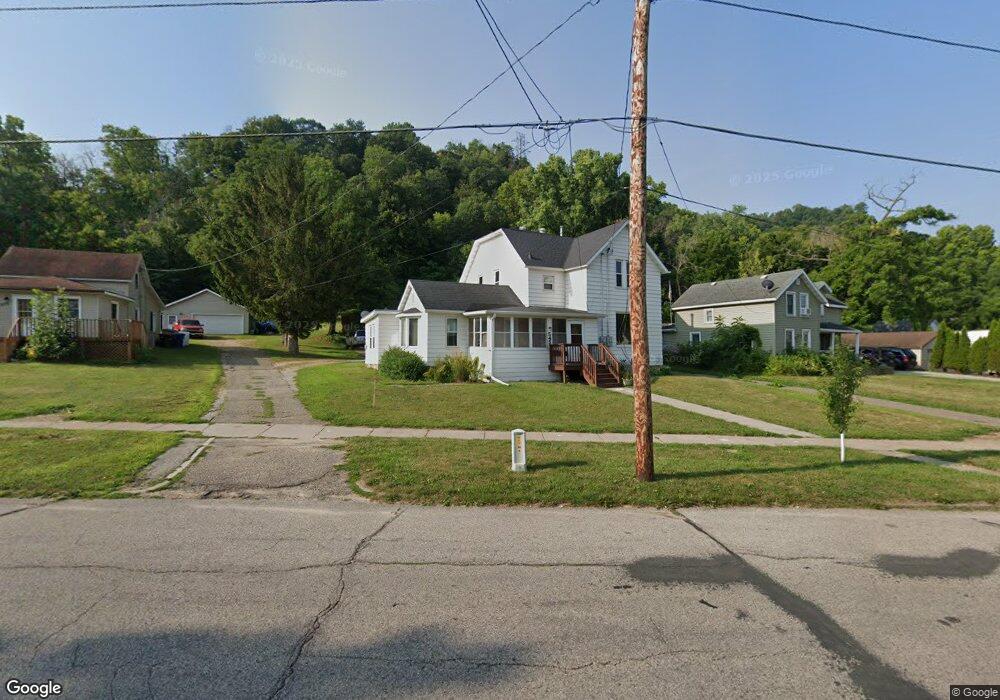
545 E 7th St Red Wing, MN 55066
Estimated Value: $218,000 - $275,410
5
Beds
3
Baths
3,840
Sq Ft
$65/Sq Ft
Est. Value
About This Home
This home is located at 545 E 7th St, Red Wing, MN 55066 and is currently estimated at $251,353, approximately $65 per square foot. 545 E 7th St is a home located in Goodhue County with nearby schools including Sunnyside Elementary School, Burnside Elementary School, and Twin Bluff Middle School.
Ownership History
Date
Name
Owned For
Owner Type
Purchase Details
Closed on
Jun 29, 2023
Sold by
Jevika Llc
Bought by
Engberg Properties Llc
Current Estimated Value
Purchase Details
Closed on
Jul 10, 2020
Sold by
Smith Everett H and Everett H Smith Revocable Trus
Bought by
Jevika Llc
Home Financials for this Owner
Home Financials are based on the most recent Mortgage that was taken out on this home.
Original Mortgage
$132,000
Interest Rate
3.1%
Mortgage Type
Future Advance Clause Open End Mortgage
Purchase Details
Closed on
Apr 16, 2009
Sold by
Gmac Mortgage Llc
Bought by
Not Provided
Purchase Details
Closed on
Sep 26, 2003
Sold by
Federal National Mortgage Association
Bought by
Miller Jason
Purchase Details
Closed on
Sep 1, 1999
Sold by
Wilson Eugene L
Bought by
Page Kenneth L and Page Stacy M
Create a Home Valuation Report for This Property
The Home Valuation Report is an in-depth analysis detailing your home's value as well as a comparison with similar homes in the area
Home Values in the Area
Average Home Value in this Area
Purchase History
| Date | Buyer | Sale Price | Title Company |
|---|---|---|---|
| Engberg Properties Llc | $125,000 | None Listed On Document | |
| Jevika Llc | $165,000 | None Available | |
| Not Provided | $64,000 | -- | |
| Miller Jason | $106,200 | -- | |
| Page Kenneth L | $84,500 | -- |
Source: Public Records
Mortgage History
| Date | Status | Borrower | Loan Amount |
|---|---|---|---|
| Previous Owner | Jevika Llc | $132,000 |
Source: Public Records
Tax History
| Year | Tax Paid | Tax Assessment Tax Assessment Total Assessment is a certain percentage of the fair market value that is determined by local assessors to be the total taxable value of land and additions on the property. | Land | Improvement |
|---|---|---|---|---|
| 2025 | $3,256 | $244,800 | $46,600 | $198,200 |
| 2024 | -- | $240,300 | $46,600 | $193,700 |
| 2023 | $3,076 | $228,300 | $46,800 | $181,500 |
| 2022 | $2,936 | $226,900 | $46,800 | $180,100 |
| 2021 | $2,732 | $196,300 | $46,800 | $149,500 |
| 2020 | $2,634 | $185,100 | $46,800 | $138,300 |
| 2019 | $2,560 | $166,400 | $46,800 | $119,600 |
| 2018 | $2,132 | $163,600 | $42,600 | $121,000 |
| 2017 | $2,098 | $144,300 | $42,600 | $101,700 |
| 2016 | $1,904 | $143,800 | $42,600 | $101,200 |
| 2015 | $1,844 | $136,600 | $42,600 | $94,000 |
| 2014 | -- | $131,400 | $42,600 | $88,800 |
Source: Public Records
Map
Nearby Homes
- XXXX Skyline Heights
- 803 Wilkinson St
- 1547 Bush St
- 225 E 5th St
- 759 Plum St
- 320 W 7th St
- 418 8th St
- 1218 East Ave
- 528 20th St
- 520 10th St
- 222 Bush St Unit 402
- 222 Bush St Unit 302
- 222 Bush St Unit 404
- 222 Bush St Unit 303
- 222 Bush St Unit 301
- 222 Bush St Unit 304
- 222 Bush St Unit 401
- 814 Central Ave
- 1003 Central Ave
- 1315 12th St
Your Personal Tour Guide
Ask me questions while you tour the home.