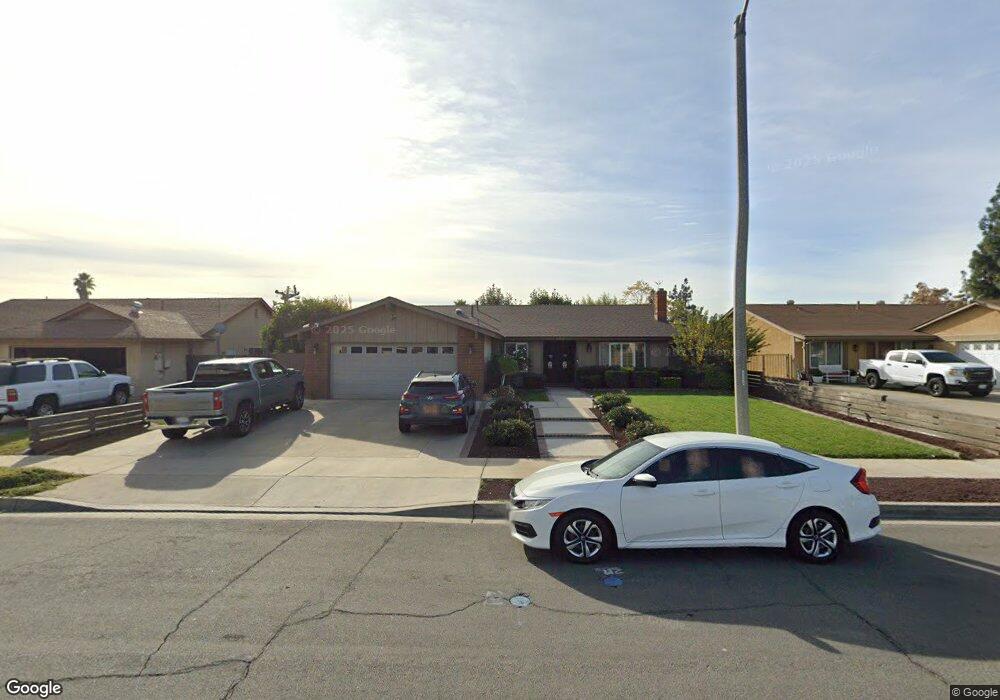
545 Montezuma St Ontario, CA 91762
Downtown Ontario NeighborhoodEstimated Value: $744,136 - $837,000
4
Beds
2
Baths
1,872
Sq Ft
$419/Sq Ft
Est. Value
About This Home
This home is located at 545 Montezuma St, Ontario, CA 91762 and is currently estimated at $784,284, approximately $418 per square foot. 545 Montezuma St is a home located in San Bernardino County with nearby schools including Richard Haynes Elementary, Oaks Middle, and Ontario High School.
Ownership History
Date
Name
Owned For
Owner Type
Purchase Details
Closed on
Sep 9, 2018
Sold by
Guerrero Jesus S
Bought by
Guerrero Jesus S and Guerrero Maria T
Current Estimated Value
Purchase Details
Closed on
Jun 27, 2002
Sold by
Wunderlin Gary Charles
Bought by
Guerrero Jesus S and Guerrero Maria T
Home Financials for this Owner
Home Financials are based on the most recent Mortgage that was taken out on this home.
Original Mortgage
$172,000
Interest Rate
6.43%
Create a Home Valuation Report for This Property
The Home Valuation Report is an in-depth analysis detailing your home's value as well as a comparison with similar homes in the area
Home Values in the Area
Average Home Value in this Area
Purchase History
| Date | Buyer | Sale Price | Title Company |
|---|---|---|---|
| Guerrero Jesus S | -- | None Available | |
| Guerrero Jesus S | $215,000 | American Title Co |
Source: Public Records
Mortgage History
| Date | Status | Borrower | Loan Amount |
|---|---|---|---|
| Previous Owner | Guerrero Jesus S | $172,000 |
Source: Public Records
Tax History Compared to Growth
Tax History
| Year | Tax Paid | Tax Assessment Tax Assessment Total Assessment is a certain percentage of the fair market value that is determined by local assessors to be the total taxable value of land and additions on the property. | Land | Improvement |
|---|---|---|---|---|
| 2025 | $3,421 | $311,393 | $108,987 | $202,406 |
| 2024 | $3,421 | $305,287 | $106,850 | $198,437 |
| 2023 | $3,327 | $299,301 | $104,755 | $194,546 |
| 2022 | $3,283 | $293,432 | $102,701 | $190,731 |
| 2021 | $3,264 | $287,678 | $100,687 | $186,991 |
| 2020 | $3,208 | $284,729 | $99,655 | $185,074 |
| 2019 | $3,181 | $279,146 | $97,701 | $181,445 |
| 2018 | $3,138 | $273,672 | $95,785 | $177,887 |
| 2017 | $3,028 | $268,306 | $93,907 | $174,399 |
| 2016 | $2,911 | $263,045 | $92,066 | $170,979 |
| 2015 | $2,892 | $259,094 | $90,683 | $168,411 |
| 2014 | $2,804 | $254,019 | $88,907 | $165,112 |
Source: Public Records
Map
Nearby Homes
- 559 W Belmont St
- 1546 Redwood Ave
- 653 W Belmont St
- 550 W Belmont St
- 646 W Belmont St
- 754 W Belmont St
- 1214 S Cypress Ave Unit G
- 1620 S Cypress Ave
- 1216 S Cypress Ave Unit E
- 1420 S Euclid Ave Unit A & B
- 4251 S Grasly Paseo
- 410 W Maitland St
- 1031 S Palmetto Ave Unit N9
- 1031 S Palmetto Ave Unit W8
- 1031 S Palmetto Ave Unit II3
- 1031 S Palmetto Ave Unit N1
- 1209 S Palmetto Ave Unit C
- 1849 S San Antonio Ave
- 718 S Vine Ave Unit A
- 920 S Palmetto Ave Unit 9
- 551 Montezuma St
- 539 Montezuma St
- 550 Sonoma Ct
- 557 Montezuma St
- 556 Sonoma Ct
- 544 Sonoma Ct
- 1359 Beverly Ave
- 548 Montezuma St
- 535 Montezuma St
- 562 Sonoma Ct
- 563 Montezuma St
- 1353 Beverly Ave
- 554 Montezuma St
- 534 Sonoma Ct
- 1360 Oakland Place
- 560 Montezuma St
- 1347 Beverly Ave
- 528 Sonoma Ct
- 1354 Oakland Place
- 551 Sonoma Ct