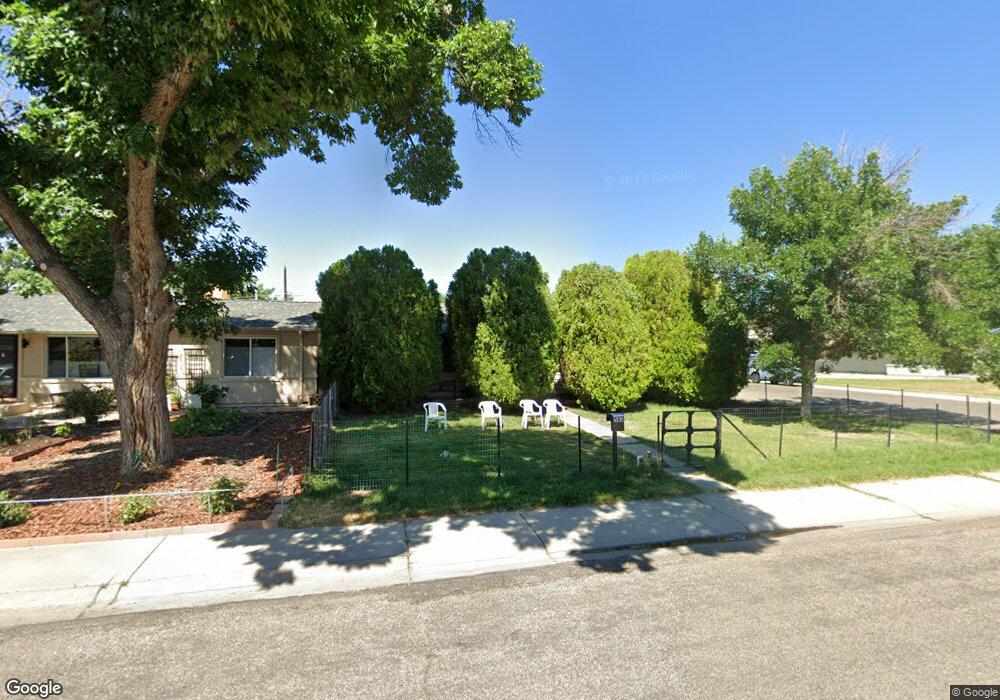
545 N 18th St Grand Junction, CO 81501
Downtown Grand Junction NeighborhoodEstimated Value: $355,000 - $438,000
3
Beds
2
Baths
1,588
Sq Ft
$244/Sq Ft
Est. Value
About This Home
This home is located at 545 N 18th St, Grand Junction, CO 81501 and is currently estimated at $387,202, approximately $243 per square foot. 545 N 18th St is a home located in Mesa County with nearby schools including Chipeta Elementary School, East Middle School, and West Middle School.
Ownership History
Date
Name
Owned For
Owner Type
Purchase Details
Closed on
May 27, 2005
Sold by
Shortess Debra J
Bought by
Lunning Andrew
Current Estimated Value
Home Financials for this Owner
Home Financials are based on the most recent Mortgage that was taken out on this home.
Original Mortgage
$144,952
Outstanding Balance
$75,820
Interest Rate
5.79%
Mortgage Type
FHA
Estimated Equity
$311,382
Purchase Details
Closed on
Apr 1, 1998
Sold by
Shortess Mark A
Bought by
Shortess Debra J
Purchase Details
Closed on
Mar 15, 1990
Sold by
Shortess Mark A
Bought by
Lunnings Andrew
Create a Home Valuation Report for This Property
The Home Valuation Report is an in-depth analysis detailing your home's value as well as a comparison with similar homes in the area
Home Values in the Area
Average Home Value in this Area
Purchase History
| Date | Buyer | Sale Price | Title Company |
|---|---|---|---|
| Lunning Andrew | $147,000 | Stewart Title | |
| Shortess Debra J | -- | -- | |
| Lunnings Andrew | -- | -- |
Source: Public Records
Mortgage History
| Date | Status | Borrower | Loan Amount |
|---|---|---|---|
| Open | Lunning Andrew | $144,952 |
Source: Public Records
Tax History Compared to Growth
Tax History
| Year | Tax Paid | Tax Assessment Tax Assessment Total Assessment is a certain percentage of the fair market value that is determined by local assessors to be the total taxable value of land and additions on the property. | Land | Improvement |
|---|---|---|---|---|
| 2024 | $1,192 | $16,860 | $4,670 | $12,190 |
| 2023 | $1,192 | $16,860 | $4,670 | $12,190 |
| 2022 | $1,153 | $16,000 | $3,820 | $12,180 |
| 2021 | $1,157 | $16,460 | $3,930 | $12,530 |
| 2020 | $908 | $13,210 | $3,580 | $9,630 |
| 2019 | $858 | $13,210 | $3,580 | $9,630 |
| 2018 | $773 | $10,930 | $3,240 | $7,690 |
| 2017 | $771 | $10,930 | $3,240 | $7,690 |
| 2016 | $726 | $11,580 | $3,380 | $8,200 |
| 2015 | $736 | $11,580 | $3,380 | $8,200 |
| 2014 | $682 | $10,810 | $2,790 | $8,020 |
Source: Public Records
Map
Nearby Homes