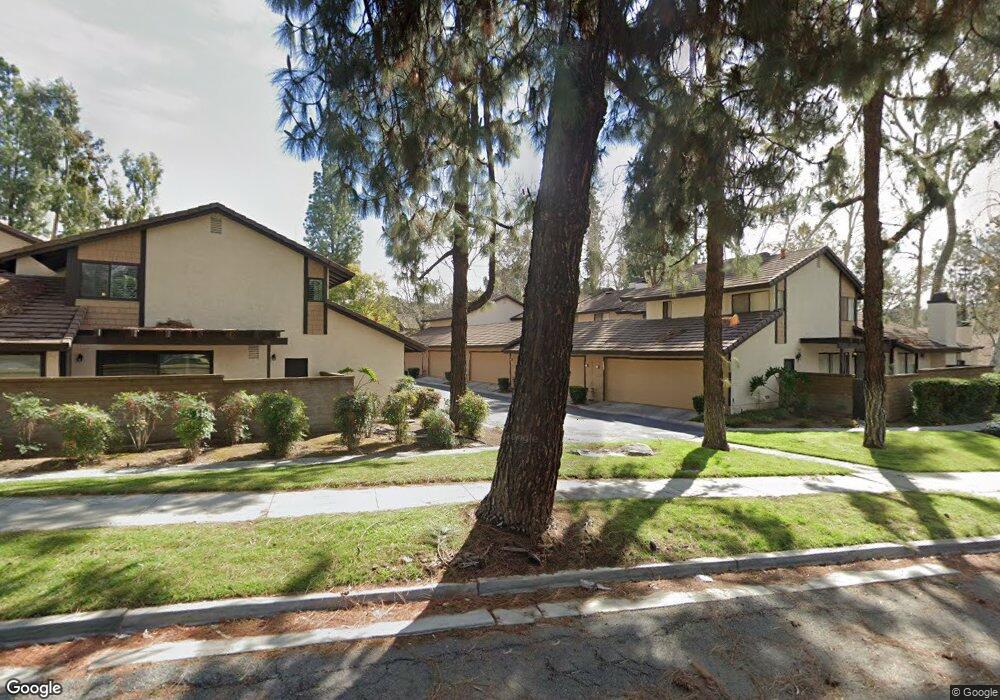
5454 Via Del Tecolote Riverside, CA 92507
Canyon Crest NeighborhoodEstimated Value: $474,000 - $515,853
3
Beds
2
Baths
1,564
Sq Ft
$316/Sq Ft
Est. Value
About This Home
This home is located at 5454 Via Del Tecolote, Riverside, CA 92507 and is currently estimated at $493,963, approximately $315 per square foot. 5454 Via Del Tecolote is a home located in Riverside County with nearby schools including Emerson Elementary School, University Heights Middle School, and John W. North High School.
Ownership History
Date
Name
Owned For
Owner Type
Purchase Details
Closed on
Jul 1, 2022
Sold by
Berman David William
Bought by
David W Berman Living Trust and Berman
Current Estimated Value
Purchase Details
Closed on
Oct 7, 2002
Sold by
Miller Robert J and Miller Christina Waayenberg
Bought by
Berman David William
Home Financials for this Owner
Home Financials are based on the most recent Mortgage that was taken out on this home.
Original Mortgage
$115,000
Interest Rate
5.88%
Mortgage Type
Stand Alone First
Purchase Details
Closed on
Aug 13, 2002
Sold by
Smyth Christina H and Miller Christina Waayenberg
Bought by
Miller Robert J and Miller Christina Waayenberg
Home Financials for this Owner
Home Financials are based on the most recent Mortgage that was taken out on this home.
Original Mortgage
$115,000
Interest Rate
5.88%
Mortgage Type
Stand Alone First
Purchase Details
Closed on
Aug 2, 2000
Sold by
Berg Judy
Bought by
Smyth Christina H
Create a Home Valuation Report for This Property
The Home Valuation Report is an in-depth analysis detailing your home's value as well as a comparison with similar homes in the area
Home Values in the Area
Average Home Value in this Area
Purchase History
| Date | Buyer | Sale Price | Title Company |
|---|---|---|---|
| David W Berman Living Trust | -- | Vondriska Carolyn J | |
| Berman David William | $175,000 | -- | |
| Miller Robert J | -- | -- | |
| Smyth Christina H | $128,000 | First American Title Co |
Source: Public Records
Mortgage History
| Date | Status | Borrower | Loan Amount |
|---|---|---|---|
| Previous Owner | Berman David William | $115,000 |
Source: Public Records
Tax History
| Year | Tax Paid | Tax Assessment Tax Assessment Total Assessment is a certain percentage of the fair market value that is determined by local assessors to be the total taxable value of land and additions on the property. | Land | Improvement |
|---|---|---|---|---|
| 2025 | $2,652 | $249,806 | $50,677 | $199,129 |
| 2023 | $2,652 | $240,108 | $48,710 | $191,398 |
| 2022 | $2,590 | $235,401 | $47,755 | $187,646 |
| 2021 | $2,564 | $230,786 | $46,819 | $183,967 |
| 2020 | $2,544 | $228,420 | $46,339 | $182,081 |
| 2019 | $2,495 | $223,942 | $45,431 | $178,511 |
| 2018 | $2,446 | $219,552 | $44,541 | $175,011 |
| 2017 | $2,402 | $215,248 | $43,668 | $171,580 |
| 2016 | $2,247 | $211,028 | $42,812 | $168,216 |
| 2015 | $2,214 | $207,861 | $42,170 | $165,691 |
| 2014 | $2,192 | $203,792 | $41,345 | $162,447 |
Source: Public Records
Map
Nearby Homes
- 718 Via la Paloma
- 702 Via Zapata
- 5555 Canyon Crest Dr Unit 2G
- 1006 Via Zapata
- 600 Central Ave Unit 291
- 1000 Central Ave Unit 8
- 700 Via Concepcion
- 5050 Canyon Crest Dr Unit 7
- 510 Via Zapata
- 1156 Lyndhurst Dr
- 5110 Caldera Ct
- 375 Central Ave Unit 124
- 375 Central Ave Unit 83
- 1250 Blazewood St
- 20996 Mountain Gate Dr
- 5423 Canmore Ct
- 1420 Timberlane Dr
- 5300 Via San Jacinto
- 1451 Trenton Dr
- 1615 Ransom Rd
- 5452 Via Del Tecolote
- 5456 Via Del Tecolote
- 5450 Via Del Tecolote
- 5448 Via Del Tecolote
- 5453 Via Del Tecolote
- 5455 Via Del Tecolote
- 5451 Via Del Tecolote
- 5437 Via Alberca
- 5449 Via Del Tecolote
- 5439 Via Alberca
- 5457 Via Del Tecolote
- 5435 Via Alberca
- 5427 Via Alberca
- 5433 Via Alberca
- 5459 Via Del Tecolote
- 5425 Via Alberca
- 5431 Via Alberca
- 5423 Via Alberca
- 5421 Via Alberca
- 5419 Via Alberca
Your Personal Tour Guide
Ask me questions while you tour the home.