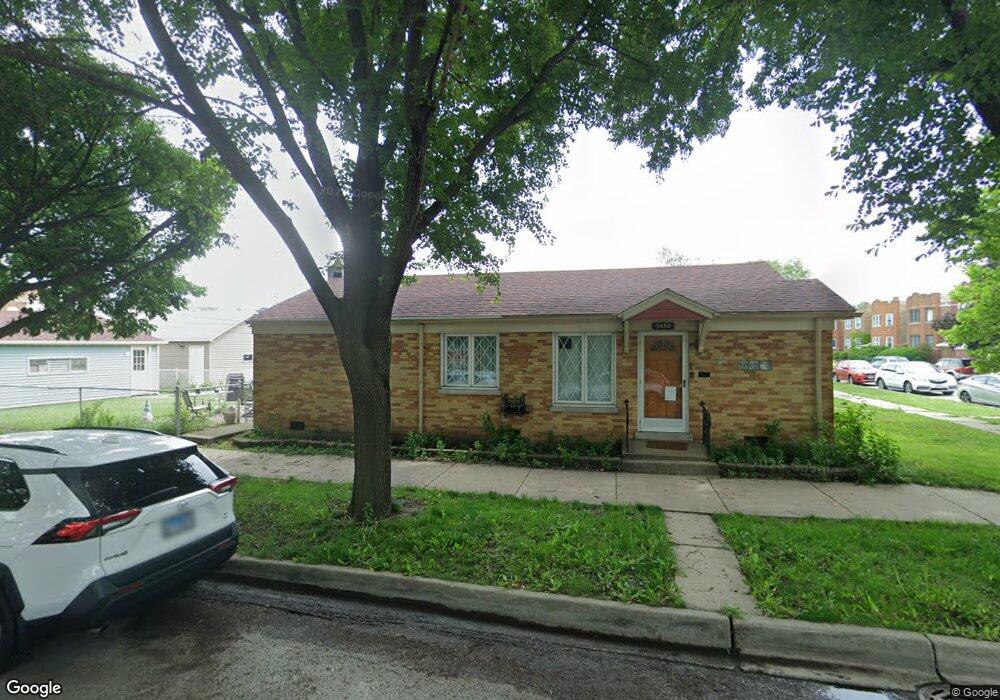
5458 W 64th St Chicago, IL 60638
Clearing NeighborhoodEstimated Value: $293,000 - $329,000
3
Beds
1
Bath
1,026
Sq Ft
$298/Sq Ft
Est. Value
About This Home
This home is located at 5458 W 64th St, Chicago, IL 60638 and is currently estimated at $305,448, approximately $297 per square foot. 5458 W 64th St is a home located in Cook County with nearby schools including Grimes Elementary School, Kennedy High School, and St. Symphorosa Catholic School.
Ownership History
Date
Name
Owned For
Owner Type
Purchase Details
Closed on
Mar 28, 2007
Sold by
Perez Manuel
Bought by
Perez Roxanna and Perez Jessica
Current Estimated Value
Home Financials for this Owner
Home Financials are based on the most recent Mortgage that was taken out on this home.
Original Mortgage
$170,000
Outstanding Balance
$101,639
Interest Rate
6.31%
Mortgage Type
Negative Amortization
Estimated Equity
$203,809
Purchase Details
Closed on
Oct 11, 2002
Sold by
Metropolitan Bank & Trust
Bought by
Perez Manuel
Purchase Details
Closed on
Aug 14, 2002
Sold by
Lyle Elizabeth
Bought by
Metropolitan Bank & Trust #2342
Purchase Details
Closed on
Jan 23, 1997
Sold by
Matug Alexander P and Gawlik Marie T
Bought by
Lyle Michael T
Home Financials for this Owner
Home Financials are based on the most recent Mortgage that was taken out on this home.
Original Mortgage
$52,500
Interest Rate
7.73%
Create a Home Valuation Report for This Property
The Home Valuation Report is an in-depth analysis detailing your home's value as well as a comparison with similar homes in the area
Home Values in the Area
Average Home Value in this Area
Purchase History
We collect this data history from publicly available records. To have your information removed, we recommend requesting removal directly through your county’s website.
| Date | Buyer | Sale Price | Title Company |
|---|---|---|---|
| Perez Roxanna | $240,000 | Multiple | |
| Perez Manuel | -- | -- | |
| Metropolitan Bank & Trust #2342 | -- | -- | |
| Metropolitan Bank & Trust #2342 | -- | -- | |
| Lyle Michael T | $70,000 | -- |
Source: Public Records
Mortgage History
We collect this data history from publicly available records. To have your information removed, we recommend requesting removal directly through your county’s website.
| Date | Status | Borrower | Loan Amount |
|---|---|---|---|
| Open | Perez Roxanna | $170,000 | |
| Previous Owner | Lyle Michael T | $52,500 |
Source: Public Records
Tax History
| Year | Tax Paid | Tax Assessment Tax Assessment Total Assessment is a certain percentage of the fair market value that is determined by local assessors to be the total taxable value of land and additions on the property. | Land | Improvement |
|---|---|---|---|---|
| 2025 | $3,115 | $23,000 | $5,600 | $17,400 |
| 2024 | $3,115 | $23,000 | $5,600 | $17,400 |
| 2023 | $3,016 | $18,000 | $5,000 | $13,000 |
| 2022 | $3,016 | $18,000 | $5,000 | $13,000 |
| 2021 | $2,950 | $18,000 | $5,000 | $13,000 |
| 2020 | $3,228 | $17,501 | $4,000 | $13,501 |
| 2019 | $3,239 | $19,446 | $4,000 | $15,446 |
| 2018 | $3,183 | $19,446 | $4,000 | $15,446 |
| 2017 | $2,969 | $17,079 | $3,600 | $13,479 |
| 2016 | $2,940 | $17,079 | $3,600 | $13,479 |
| 2015 | $2,668 | $17,079 | $3,600 | $13,479 |
| 2014 | $2,511 | $15,995 | $3,400 | $12,595 |
| 2013 | $2,450 | $15,995 | $3,400 | $12,595 |
Source: Public Records
Map
Nearby Homes
- 5423 W 63rd Place
- 5537 W 63rd Place
- 5542 W 64th St
- 6403 S Lorel Ave
- 6342 S Lockwood Ave
- 5633 W 64th Place
- 5226 W 64th Place
- 6058 S Massasoit Ave
- 6255 S Mason Ave Unit 3A
- 6217 S Mason Ave
- 5929 S Major Ave
- 6354 S Austin Ave
- 5818 W 60th St
- 6030 S Mayfield Ave
- 6019 W 64th Place Unit 23-4
- 6022 W 64th St
- 6016 S Mayfield Ave
- 6152 S Austin Ave
- 7754 S Mcvicker Ave
- 5804 W 59th St
- 5454 W 64th St
- 5448 W 64th St
- 5500 W 64th St
- 5444 W 64th St
- 5504 W 64th St
- 5457 W 63rd Place
- 5440 W 64th St
- 5455 W 63rd Place
- 5508 W 64th St
- 5449 W 63rd Place
- 5503 W 63rd Place
- 5447 W 63rd Place
- 5510 W 64th St
- 5436 W 64th St
- 5459 W 64th St
- 5443 W 63rd Place
- 5451 W 64th St
- 5507 W 63rd Place
- 5507 W 63rd Place
- 5445 W 64th St
Your Personal Tour Guide
Ask me questions while you tour the home.