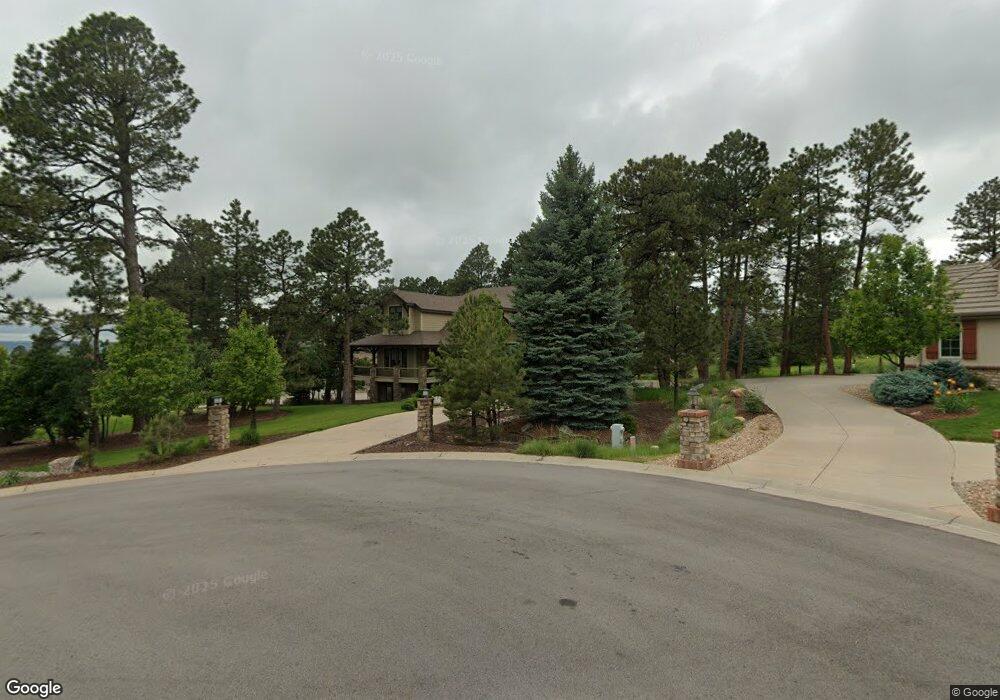
5459 Golden Currant Way Parker, CO 80134
The Pinery NeighborhoodEstimated Value: $1,338,000 - $1,405,000
5
Beds
5
Baths
5,140
Sq Ft
$267/Sq Ft
Est. Value
About This Home
This home is located at 5459 Golden Currant Way, Parker, CO 80134 and is currently estimated at $1,370,664, approximately $266 per square foot. 5459 Golden Currant Way is a home located in Douglas County with nearby schools including Mountain View Elementary School, Northeast Elementary School, and Sagewood Middle School.
Ownership History
Date
Name
Owned For
Owner Type
Purchase Details
Closed on
Dec 3, 2009
Sold by
Baker David Anthony and Baker Catherine Teele
Bought by
Preble Randall and Preble Lisa
Current Estimated Value
Home Financials for this Owner
Home Financials are based on the most recent Mortgage that was taken out on this home.
Original Mortgage
$360,000
Outstanding Balance
$236,733
Interest Rate
5.06%
Mortgage Type
New Conventional
Estimated Equity
$1,133,931
Purchase Details
Closed on
Dec 6, 1999
Sold by
Eldorado Homes Inc
Bought by
Baker David Anthony and Baker Catherine Teele
Home Financials for this Owner
Home Financials are based on the most recent Mortgage that was taken out on this home.
Original Mortgage
$448,000
Interest Rate
7.93%
Purchase Details
Closed on
Jul 2, 1998
Sold by
Pinery Joint Venture
Bought by
Eldorado Homes Inc
Create a Home Valuation Report for This Property
The Home Valuation Report is an in-depth analysis detailing your home's value as well as a comparison with similar homes in the area
Home Values in the Area
Average Home Value in this Area
Purchase History
| Date | Buyer | Sale Price | Title Company |
|---|---|---|---|
| Preble Randall | $656,250 | Htco | |
| Baker David Anthony | $648,000 | Empire Title & Escrow | |
| Eldorado Homes Inc | $73,500 | -- |
Source: Public Records
Mortgage History
| Date | Status | Borrower | Loan Amount |
|---|---|---|---|
| Open | Preble Randall | $360,000 | |
| Previous Owner | Baker David Anthony | $448,000 |
Source: Public Records
Tax History Compared to Growth
Tax History
| Year | Tax Paid | Tax Assessment Tax Assessment Total Assessment is a certain percentage of the fair market value that is determined by local assessors to be the total taxable value of land and additions on the property. | Land | Improvement |
|---|---|---|---|---|
| 2024 | $8,522 | $92,950 | $17,070 | $75,880 |
| 2023 | $8,604 | $92,950 | $17,070 | $75,880 |
| 2022 | $5,913 | $63,820 | $10,770 | $53,050 |
| 2021 | $6,147 | $63,820 | $10,770 | $53,050 |
| 2020 | $5,340 | $56,800 | $11,340 | $45,460 |
| 2019 | $5,358 | $56,800 | $11,340 | $45,460 |
| 2018 | $5,388 | $56,250 | $8,940 | $47,310 |
| 2017 | $5,037 | $56,250 | $8,940 | $47,310 |
| 2016 | $5,147 | $56,440 | $8,760 | $47,680 |
| 2015 | $5,261 | $56,440 | $8,760 | $47,680 |
| 2014 | $5,081 | $49,410 | $5,970 | $43,440 |
Source: Public Records
Map
Nearby Homes
- 7755 Running Fox Way
- 5577 N Quinlin Ct
- 5649 N Quinlin Ct
- 8136 E Stetson Rd
- 5602 Silver Bluff Ct
- 5284 Pinyon Jay Rd
- 8389 Owl Roost Ct
- 7493 Nuthatch Cir
- 5086 Fox Sparrow Rd
- 5769 N Irish Pat Murphy Dr
- 5776 Autumn Brush Ct
- 5189 Warbler Ct
- 7209 N Hyperion Way
- 5059 Barn Swallow Way
- 7351 Meadow View
- 8707 Windhaven Dr
- 8498 E Lightening View Dr
- 7755 E Lakeshore Dr
- 9132 Scenic Pine Dr
- 5612 Ponderosa Dr
- 5441 Golden Currant Way
- 5448 Golden Currant Way
- 5452 Golden Currant Way
- 5462 Golden Currant Way
- 5431 Golden Currant Way
- 5464 Soapweed Cir
- 5474 Golden Currant Way
- 5428 Golden Currant Way
- 5450 Soapweed Cir
- 5419 Golden Currant Way
- 7971 Towhee Rd
- 7985 Towhee Rd
- 5477 Soapweed Cir
- 8065 Towhee Rd
- 8049 Towhee Rd
- 7997 Towhee Rd
- 5407 Golden Currant Way
- 5426 Soapweed Cir
- 8019 Towhee Rd
- 5402 Golden Currant Way