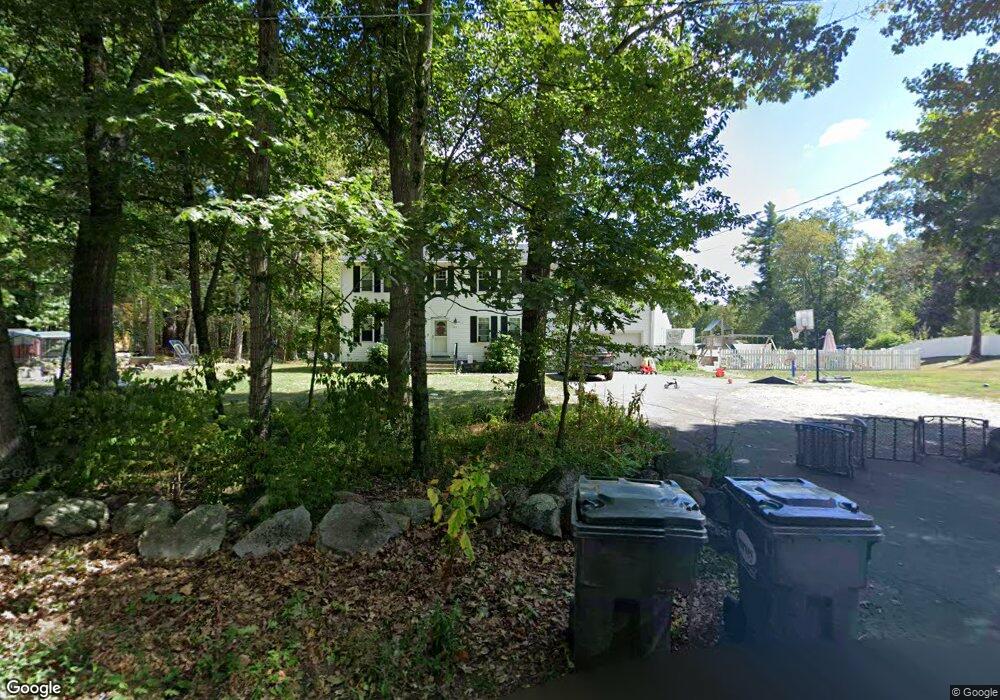
546 South Rd Templeton, MA 01468
Estimated Value: $487,000 - $514,000
4
Beds
3
Baths
2,128
Sq Ft
$236/Sq Ft
Est. Value
About This Home
This home is located at 546 South Rd, Templeton, MA 01468 and is currently estimated at $503,210, approximately $236 per square foot. 546 South Rd is a home located in Worcester County with nearby schools including Narragansett Regional High School.
Ownership History
Date
Name
Owned For
Owner Type
Purchase Details
Closed on
Oct 17, 2019
Sold by
Baumann Justin L
Bought by
Baumann Justin L and Baumann Cambri L
Current Estimated Value
Home Financials for this Owner
Home Financials are based on the most recent Mortgage that was taken out on this home.
Original Mortgage
$210,000
Outstanding Balance
$136,730
Interest Rate
3.2%
Mortgage Type
New Conventional
Estimated Equity
$366,480
Purchase Details
Closed on
Jun 7, 2013
Sold by
Manca Peter A and Manca Amanda M
Bought by
Baumann Justin L
Home Financials for this Owner
Home Financials are based on the most recent Mortgage that was taken out on this home.
Original Mortgage
$198,850
Interest Rate
3.43%
Mortgage Type
New Conventional
Purchase Details
Closed on
Jul 31, 2007
Sold by
Harris Debra A and Landry Debra A
Bought by
Mcauliffe Amanda M and Manca Peter A
Home Financials for this Owner
Home Financials are based on the most recent Mortgage that was taken out on this home.
Original Mortgage
$223,155
Interest Rate
6.78%
Mortgage Type
Purchase Money Mortgage
Create a Home Valuation Report for This Property
The Home Valuation Report is an in-depth analysis detailing your home's value as well as a comparison with similar homes in the area
Home Values in the Area
Average Home Value in this Area
Purchase History
| Date | Buyer | Sale Price | Title Company |
|---|---|---|---|
| Baumann Justin L | -- | -- | |
| Baumann Justin L | $205,000 | -- | |
| Baumann Justin L | $205,000 | -- | |
| Baumann Justin L | $205,000 | -- | |
| Mcauliffe Amanda M | $234,900 | -- | |
| Mcauliffe Amanda M | $234,900 | -- |
Source: Public Records
Mortgage History
| Date | Status | Borrower | Loan Amount |
|---|---|---|---|
| Open | Baumann Justin L | $210,000 | |
| Previous Owner | Baumann Justin L | $198,850 | |
| Previous Owner | Mcauliffe Amanda M | $192,000 | |
| Previous Owner | Mcauliffe Amanda M | $223,155 |
Source: Public Records
Tax History Compared to Growth
Tax History
| Year | Tax Paid | Tax Assessment Tax Assessment Total Assessment is a certain percentage of the fair market value that is determined by local assessors to be the total taxable value of land and additions on the property. | Land | Improvement |
|---|---|---|---|---|
| 2025 | $4,978 | $410,700 | $58,800 | $351,900 |
| 2024 | $4,658 | $369,700 | $51,800 | $317,900 |
| 2023 | $4,324 | $334,700 | $51,800 | $282,900 |
| 2022 | $4,284 | $281,100 | $37,000 | $244,100 |
| 2021 | $4,214 | $261,600 | $37,000 | $224,600 |
| 2020 | $4,239 | $251,900 | $37,000 | $214,900 |
| 2018 | $3,673 | $219,700 | $33,500 | $186,200 |
| 2017 | $3,477 | $215,700 | $33,500 | $182,200 |
| 2016 | $3,394 | $206,100 | $33,500 | $172,600 |
| 2015 | $3,393 | $203,900 | $35,300 | $168,600 |
| 2014 | $3,461 | $213,100 | $35,300 | $177,800 |
Source: Public Records
Map
Nearby Homes
- 3 Gary Rd
- 65 Victoria Ln
- 171 South Rd
- 254 Gardner Rd
- 40 Burnshirt Rd
- 87 Hubbardston Rd
- 0 Williamsville Rd
- 0 Hubbardston Rd Unit 73407169
- 225 Queen Lake Rd
- 14 Baldwinville Rd
- 99 Turner Ln
- 240 Barre Rd
- 18 S Main St
- 63 Gardner Rd
- 72 Cottage Ln Unit (A)
- 72 Cottage Ln Unit (B)
- 133 Patriots Rd
- 0 Gardner Rd Unit Applewood
- 0 Gardner Rd Unit Willow
- 14 Baker Ln