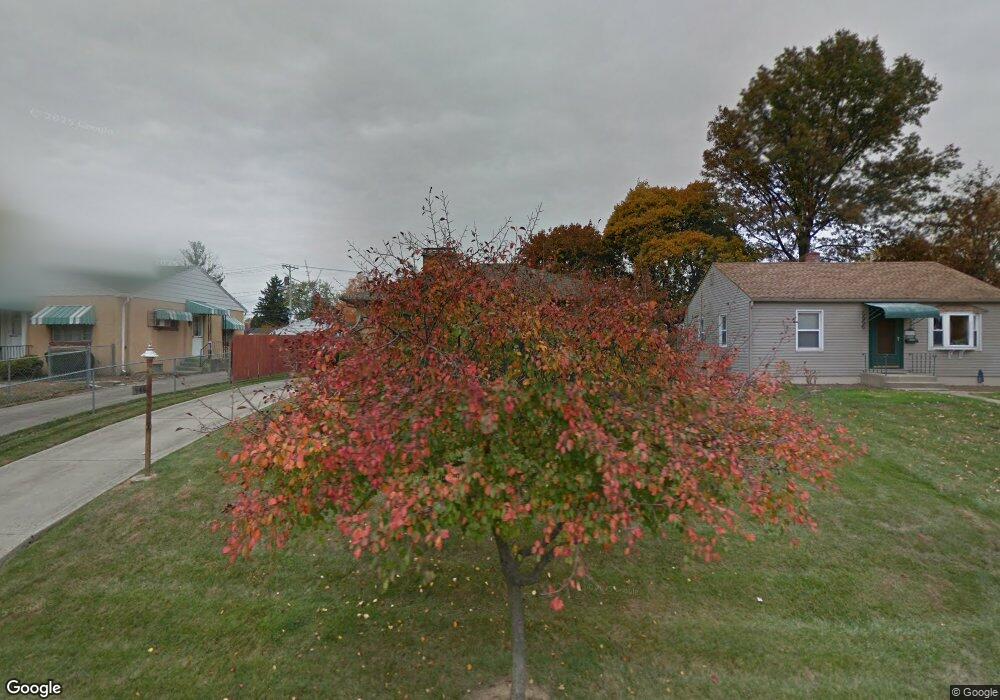
546 Wetmore Rd Columbus, OH 43214
Clintonville NeighborhoodEstimated Value: $357,000 - $392,000
2
Beds
1
Bath
1,002
Sq Ft
$367/Sq Ft
Est. Value
About This Home
This home is located at 546 Wetmore Rd, Columbus, OH 43214 and is currently estimated at $367,814, approximately $367 per square foot. 546 Wetmore Rd is a home located in Franklin County with nearby schools including Colerain Elementary School, Dominion Middle School, and Whetstone High School.
Ownership History
Date
Name
Owned For
Owner Type
Purchase Details
Closed on
Apr 30, 2003
Sold by
Kennedy Brian J and Kennedy Stephnie D
Bought by
Cless Ann
Current Estimated Value
Purchase Details
Closed on
Oct 31, 2000
Sold by
Colwell Kevin A and Colwell Suzanne M
Bought by
Hastings Stephnie D and Kennedy Brian J
Purchase Details
Closed on
Oct 23, 1996
Sold by
Thomas Terry M
Bought by
Colwell Kevin A and Colwell Suzanne H
Home Financials for this Owner
Home Financials are based on the most recent Mortgage that was taken out on this home.
Original Mortgage
$94,325
Interest Rate
8.32%
Mortgage Type
FHA
Purchase Details
Closed on
Jan 1, 1985
Create a Home Valuation Report for This Property
The Home Valuation Report is an in-depth analysis detailing your home's value as well as a comparison with similar homes in the area
Home Values in the Area
Average Home Value in this Area
Purchase History
| Date | Buyer | Sale Price | Title Company |
|---|---|---|---|
| Cless Ann | $157,000 | Title First Agency Inc | |
| Hastings Stephnie D | $137,000 | -- | |
| Colwell Kevin A | $94,900 | -- | |
| -- | -- | -- |
Source: Public Records
Mortgage History
| Date | Status | Borrower | Loan Amount |
|---|---|---|---|
| Previous Owner | Colwell Kevin A | $94,325 |
Source: Public Records
Tax History Compared to Growth
Tax History
| Year | Tax Paid | Tax Assessment Tax Assessment Total Assessment is a certain percentage of the fair market value that is determined by local assessors to be the total taxable value of land and additions on the property. | Land | Improvement |
|---|---|---|---|---|
| 2024 | $4,950 | $110,290 | $54,850 | $55,440 |
| 2023 | $4,887 | $110,290 | $54,850 | $55,440 |
| 2022 | $4,500 | $86,770 | $44,310 | $42,460 |
| 2021 | $4,508 | $86,770 | $44,310 | $42,460 |
| 2020 | $4,514 | $86,770 | $44,310 | $42,460 |
| 2019 | $3,962 | $65,310 | $34,090 | $31,220 |
| 2018 | $3,762 | $65,310 | $34,090 | $31,220 |
| 2017 | $3,946 | $65,310 | $34,090 | $31,220 |
| 2016 | $3,933 | $59,370 | $19,780 | $39,590 |
| 2015 | $3,570 | $59,370 | $19,780 | $39,590 |
| 2014 | $3,579 | $59,370 | $19,780 | $39,590 |
| 2013 | $1,681 | $56,525 | $18,830 | $37,695 |
Source: Public Records
Map
Nearby Homes
- 522 E Beechwold Blvd
- 518 E Royal Forest Blvd
- 420 E Beechwold Blvd
- 411 Garden Rd
- 597 Morse Rd
- 601 Morse Rd
- 381 E Jeffrey Place
- 255 Garden Rd
- 4299 Colerain Ave
- 156 E Weisheimer Rd
- 4193 Eastlea Dr
- 814 Meadowview Dr
- 1071 Loring Rd
- 197 E Cooke Rd
- 340 Canyon Dr S
- 685 Yaronia Dr N
- 4 W Royal Forest Blvd
- 4441 Wetmore Rd E
- 4000 Indianola Ave
- 125 Sheffield Rd
- 552 Wetmore Rd
- 536 Wetmore Rd
- 560 Wetmore Rd
- 528 Wetmore Rd
- 570 Wetmore Rd
- 522 Wetmore Rd
- 543 E Beechwold Blvd
- 549 E Beechwold Blvd
- 553 E Beechwold Blvd
- 533 E Beechwold Blvd
- 559 E Beechwold Blvd
- 527 E Beechwold Blvd
- 541 Wetmore Rd
- 563 E Beechwold Blvd
- 549 Wetmore Rd
- 512 Wetmore Rd
- 578 Wetmore Rd
- 535 Wetmore Rd
- 555 Wetmore Rd
- 521 E Beechwold Blvd