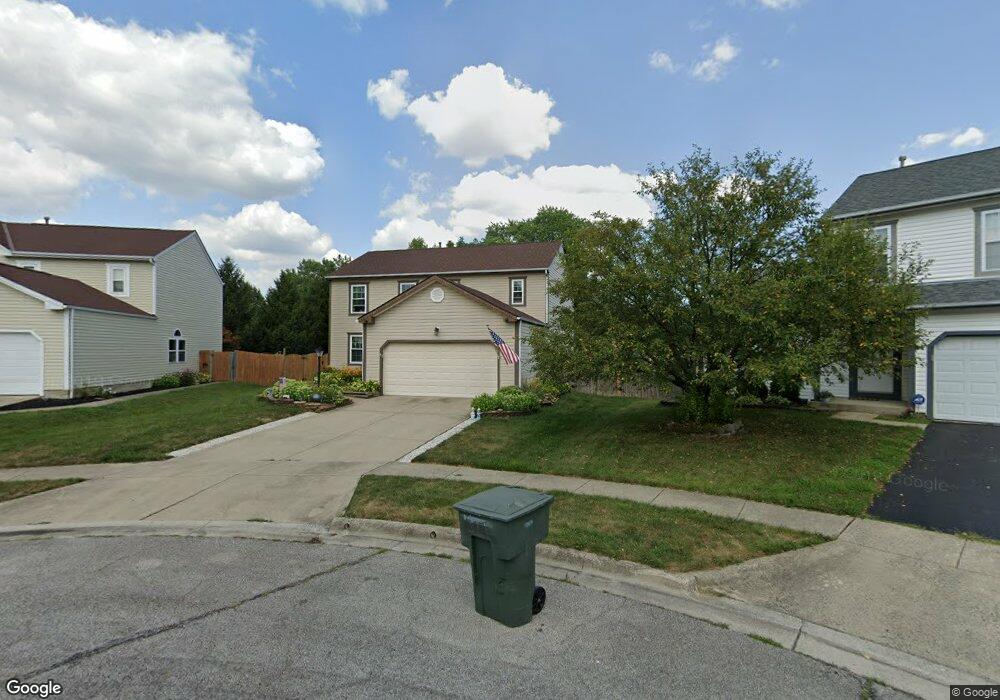
5468 Avonhurst Ct Galloway, OH 43119
Westchester-Green Countrie NeighborhoodEstimated Value: $314,000 - $386,000
4
Beds
3
Baths
2,248
Sq Ft
$154/Sq Ft
Est. Value
About This Home
This home is located at 5468 Avonhurst Ct, Galloway, OH 43119 and is currently estimated at $346,716, approximately $154 per square foot. 5468 Avonhurst Ct is a home located in Franklin County with nearby schools including Darby Woods Elementary School, Galloway Ridge Intermediate School, and Norton Middle School.
Ownership History
Date
Name
Owned For
Owner Type
Purchase Details
Closed on
Oct 1, 2001
Sold by
Diamond Shari Lynn
Bought by
Diamond John R and Diamond Susan Ann
Current Estimated Value
Home Financials for this Owner
Home Financials are based on the most recent Mortgage that was taken out on this home.
Original Mortgage
$127,000
Interest Rate
6.99%
Purchase Details
Closed on
Apr 25, 2000
Sold by
Diamond Laura M and Diamond Shari L
Bought by
Diamond John R and Diamond Susan Ann
Purchase Details
Closed on
Nov 18, 1997
Sold by
Maronda Homes Inc
Bought by
Diamond Laura M and Diamond Shari L
Home Financials for this Owner
Home Financials are based on the most recent Mortgage that was taken out on this home.
Original Mortgage
$126,687
Interest Rate
7.38%
Mortgage Type
FHA
Create a Home Valuation Report for This Property
The Home Valuation Report is an in-depth analysis detailing your home's value as well as a comparison with similar homes in the area
Home Values in the Area
Average Home Value in this Area
Purchase History
| Date | Buyer | Sale Price | Title Company |
|---|---|---|---|
| Diamond John R | $36,000 | -- | |
| Diamond John R | -- | -- | |
| Diamond Laura M | $132,200 | -- |
Source: Public Records
Mortgage History
| Date | Status | Borrower | Loan Amount |
|---|---|---|---|
| Previous Owner | Diamond John R | $127,000 | |
| Previous Owner | Diamond Laura M | $126,687 |
Source: Public Records
Tax History
| Year | Tax Paid | Tax Assessment Tax Assessment Total Assessment is a certain percentage of the fair market value that is determined by local assessors to be the total taxable value of land and additions on the property. | Land | Improvement |
|---|---|---|---|---|
| 2025 | $3,714 | $111,660 | $28,880 | $82,780 |
| 2024 | $3,714 | $111,660 | $28,880 | $82,780 |
| 2023 | $3,671 | $111,660 | $28,880 | $82,780 |
| 2022 | $2,675 | $63,560 | $6,580 | $56,980 |
| 2021 | $2,729 | $63,560 | $6,580 | $56,980 |
| 2020 | $2,713 | $63,560 | $6,580 | $56,980 |
| 2019 | $2,457 | $52,540 | $5,250 | $47,290 |
| 2018 | $2,402 | $52,540 | $5,250 | $47,290 |
| 2017 | $2,396 | $52,540 | $5,250 | $47,290 |
| 2016 | $2,359 | $47,740 | $8,190 | $39,550 |
| 2015 | $2,359 | $47,740 | $8,190 | $39,550 |
| 2014 | $2,361 | $47,740 | $8,190 | $39,550 |
| 2013 | $1,424 | $56,140 | $9,625 | $46,515 |
Source: Public Records
Map
Nearby Homes
- 429 Postle Blvd
- 352 Postle Blvd
- 110 Inah Ave
- 354 Fernhill Ave
- 443 Clairbrook Ave
- 69 Lawrence Ave
- 417 Pamlico St Unit JK2
- 400 Evergreen Terrace
- 496 Clairbrook Ave Unit Jc-13
- 89 Postle Blvd
- 5711 Greendale Dr
- 470 Woodlawn Ave
- 557 Simbury St
- 575 Dlyn St
- 614 Dlyn St
- 516 Pamlico St
- 634 Dlyn St Unit 5
- 621 Simbury St Unit D6
- 660 Dlyn St
- 154 Maple Dr
- 5474 Avonhurst Ct
- 5465 Avonhurst Ct
- 329 Norton Rd
- 5480 Avonhurst Ct
- 5471 Avonhurst Ct
- 5463 Bentonhurst Ct
- 5486 Avonhurst Ct
- 5457 Bentonhurst Ct
- 5477 Avonhurst Ct
- 5469 Bentonhurst Ct
- 5483 Avonhurst Ct
- 323 Norton Rd
- 341 Norton Rd
- 5475 Bentonhurst Ct
- 5492 Avonhurst Ct
- 5491 Avonhurst Ct
- 5451 Bentonhurst Ct
- 5481 Bentonhurst Ct
- 5499 Avonhurst Ct
- 317 Charing Cross St
Your Personal Tour Guide
Ask me questions while you tour the home.