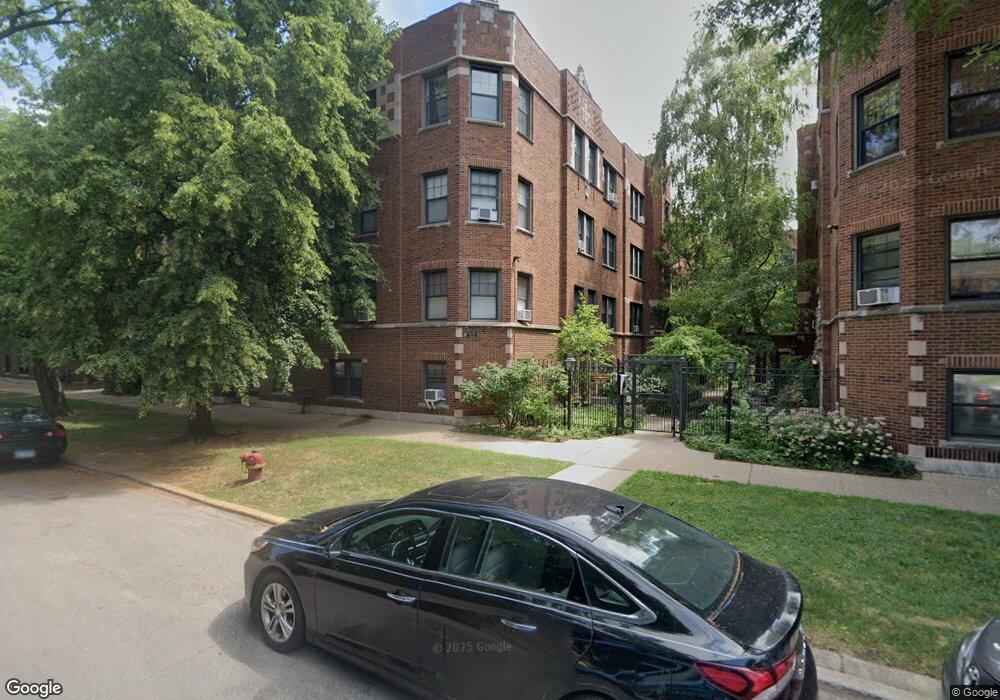
5469 S Ingleside Ave Unit 5469 Chicago, IL 60615
Hyde Park NeighborhoodEstimated Value: $280,000 - $308,000
--
Bed
--
Bath
--
Sq Ft
0.36
Acres
About This Home
This home is located at 5469 S Ingleside Ave Unit 5469, Chicago, IL 60615 and is currently estimated at $294,387. 5469 S Ingleside Ave Unit 5469 is a home located in Cook County with nearby schools including Kozminski Community Academy, Kenwood Academy High School, and St. Thomas the Apostle Elementary School.
Ownership History
Date
Name
Owned For
Owner Type
Purchase Details
Closed on
May 7, 2019
Sold by
Loudis Johnathan A and Loudis Rebecca
Bought by
Feder Jacob S and Feder Bruce S
Current Estimated Value
Home Financials for this Owner
Home Financials are based on the most recent Mortgage that was taken out on this home.
Original Mortgage
$195,700
Interest Rate
4.25%
Mortgage Type
New Conventional
Purchase Details
Closed on
Aug 16, 2013
Sold by
Richards Joanne S and Richards Meredyth
Bought by
Loudis Johnathan A
Purchase Details
Closed on
Jun 27, 2006
Sold by
Loncar Bozo and Loncar Milka
Bought by
Richards Joanne S and Richards Meredyth
Purchase Details
Closed on
Dec 4, 1998
Sold by
Gervais Jacqueline and Gervais Amy O
Bought by
Loncar Bozo and Loncar Milka
Home Financials for this Owner
Home Financials are based on the most recent Mortgage that was taken out on this home.
Original Mortgage
$61,000
Interest Rate
6.8%
Create a Home Valuation Report for This Property
The Home Valuation Report is an in-depth analysis detailing your home's value as well as a comparison with similar homes in the area
Home Values in the Area
Average Home Value in this Area
Purchase History
| Date | Buyer | Sale Price | Title Company |
|---|---|---|---|
| Feder Jacob S | $206,000 | Chicago Title | |
| Loudis Johnathan A | $130,000 | First American | |
| Richards Joanne S | $190,000 | Multiple | |
| Loncar Bozo | $81,000 | -- |
Source: Public Records
Mortgage History
| Date | Status | Borrower | Loan Amount |
|---|---|---|---|
| Previous Owner | Feder Jacob S | $195,700 | |
| Previous Owner | Loncar Bozo | $61,000 |
Source: Public Records
Tax History Compared to Growth
Tax History
| Year | Tax Paid | Tax Assessment Tax Assessment Total Assessment is a certain percentage of the fair market value that is determined by local assessors to be the total taxable value of land and additions on the property. | Land | Improvement |
|---|---|---|---|---|
| 2024 | $3,698 | $22,424 | $3,538 | $18,886 |
| 2023 | $3,570 | $20,781 | $2,854 | $17,927 |
| 2022 | $3,570 | $20,781 | $2,854 | $17,927 |
| 2021 | $4,178 | $20,779 | $2,853 | $17,926 |
| 2020 | $3,487 | $15,655 | $2,282 | $13,373 |
| 2019 | $2,736 | $17,049 | $2,282 | $14,767 |
| 2018 | $2,689 | $17,049 | $2,282 | $14,767 |
| 2017 | $2,203 | $13,609 | $1,883 | $11,726 |
| 2016 | $2,226 | $13,609 | $1,883 | $11,726 |
| 2015 | $2,013 | $13,609 | $1,883 | $11,726 |
| 2014 | $1,863 | $12,610 | $1,540 | $11,070 |
| 2013 | $1,815 | $12,610 | $1,540 | $11,070 |
Source: Public Records
Map
Nearby Homes
- 5469 S Ingleside Ave Unit 2N
- 5459 S Ingleside Ave Unit 5459
- 5455 S Ingleside Ave Unit 5455
- 1006 E 54th St Unit J-2
- 222-226 E 56th St
- 5252 S Drexel Ave Unit 3A
- 5517 S University Ave Unit 1
- 5239 S Ingleside Ave
- 1000 E 53rd St Unit 119S
- 1157 E 56th St Unit 3
- 5223 S Drexel Ave Unit 2N
- 5230 S University Ave Unit D
- 5200 S Ellis Ave Unit 202
- 5200 S Ellis Ave Unit 508
- 5312 S Woodlawn Ave Unit 1
- 5626 S Woodlawn Ave
- 5235 S University Ave
- 5638 S Woodlawn Ave
- 5408 S Kimbark Ave
- 5229 S University Ave
- 5469 S Ingleside Ave Unit 5469
- 5469 S Ingleside Ave Unit 5469
- 5469 S Ingleside Ave Unit 5469
- 5469 S Ingleside Ave Unit 5469
- 5469 S Ingleside Ave Unit 5469
- 5469 S Ingleside Ave Unit 2S
- 5469 S Ingleside Ave Unit 3S
- 5469 S Ingleside Ave
- 5469 S Ingleside Ave Unit 1S
- 5467 S Ingleside Ave Unit 1W
- 5467 S Ingleside Ave Unit 5467
- 5467 S Ingleside Ave Unit 5467
- 5467 S Ingleside Ave Unit 5467
- 5467 S Ingleside Ave Unit 5467
- 5467 S Ingleside Ave Unit 5467
- 5467 S Ingleside Ave Unit 5467
- 5467 S Ingleside Ave Unit 3W
- 5467 S Ingleside Ave Unit 1E
- 5467 S Ingleside Ave Unit 3E
- 5467 S Ingleside Ave Unit 2W